A Mystery Equity Factor
Overview
In this article, we will introduce a new mystery factor in equity investing. Over the last decade, it has exhibited little-to-no correlation with stocks, bonds, or other prominent equity factors. It has also been one of the few factors to generate positive excess returns after fees over the last decade.
Key Topics
Equity Factors
A Brief Introduction
Since Eugene Fama and Kenneth French published their seminal paper in 1992, there has been an explosion of factors published in academic literature that seek to explain the cross-section of equity market returns.
While academics can quibble over the definition of a “factor,” practitioners have largely adopted the broad categories of Value, Size, Momentum, Quality, and Low Volatility as potential drivers of excess returns in their portfolio. These factors are useful both in the development of systematic stock-picking strategies as well as the classification of discretionary managers.
Introducing a new factor into the literature is no small feat, as it requires that the returns cannot be explained by any combination of existing, accepted factors. With a limited set of historical data, finding new factors without explicit data-mining becomes an increasingly difficult exercise.
Mystery Equity Style Performance
In this analysis, we will review performance from August 2013 through August 2023. In the realm of academic factor studies, this is an incredibly limited data set and would invite scrutiny about the statistical significance of the results.
We’ve chosen this period for two reasons. First, it allows us to evaluate the net-of-fee, live performance of funds that actually implement these factors. Second, it allows us to evaluate the factors over a period when factor investing flourished in popularity, but largely struggled in performance.
In this analysis, we are going to compare the excess returns of U.S. stocks, U.S. bonds, and these factor strategies. In other words, the returns of stocks and bonds will be in excess of short-term Treasury bills and the returns of the factor strategies will be in excess of the returns of U.S. stocks.
- Excess U.S. Stocks Returns = U.S. Stocks Returns – Risk Free Rate
- Excess U.S. Bonds Returns = U.S. Bonds Returns – Risk Free Rate
- Excess Factor Returns = Factor Returns – U.S. Equity Returns
(Note that we’re being purposely vague here, as well as in the figure disclosures about precisely what we’re showing. Don’t worry, all the details are in the glossary at the end. But don’t ruin the reveal!)
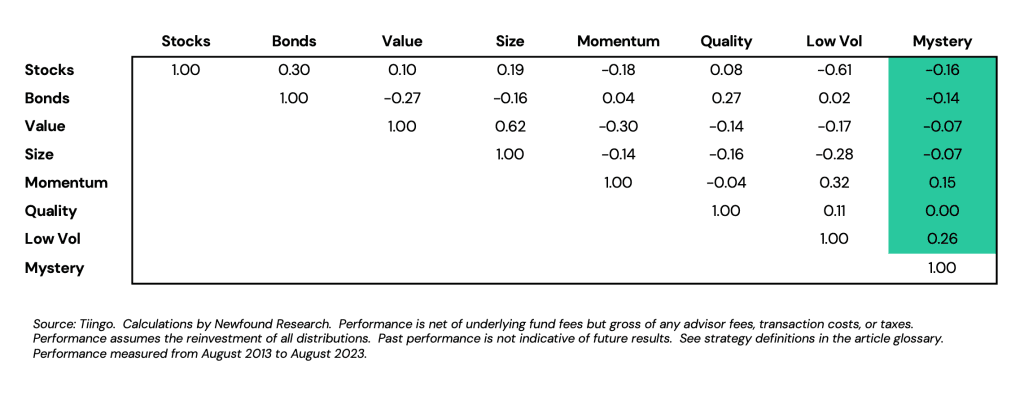
In Figure 1, we can see that the correlation of our Mystery factor has historically been near zero for both stocks, bonds, and other equity factors. This suggests that it might make an interesting diversifier to traditional equity holdings.
In Figure 2 we calculate the annualized return, volatility, and maximum drawdown over the period. As a limited sub-sample, we’d urge you not to put too much weight on the annualized return figure, but we believe the volatility and maximum drawdown calculations are worth noting.
In the case of the equity factors – which as a reminder are measured in excess of equities – annualized volatility is really tracking error and maximum drawdown is relative maximum underperformance. Tracking error tells us about the potential variability of the active returns and how much we can expect returns of the strategy to vary around Stocks. The relative maximum underperformance tells us the maximum amount the strategy has underperformed Stocks over this period.
We can see that our mystery factor has had a tracking error similar to small-cap stocks and a maximum relative drawdown lower than any other factor besides Quality.
Register for our Advisor Center
Tools Center:
Easily backtest & explore different return stacking concepts
Model Portfolios:
Return stacked allocations, commentary and guidance designed
for a range of client risk profiles and goals
Future Thinking:
Receive up-to-date insights into the world of return stacking theory and practice
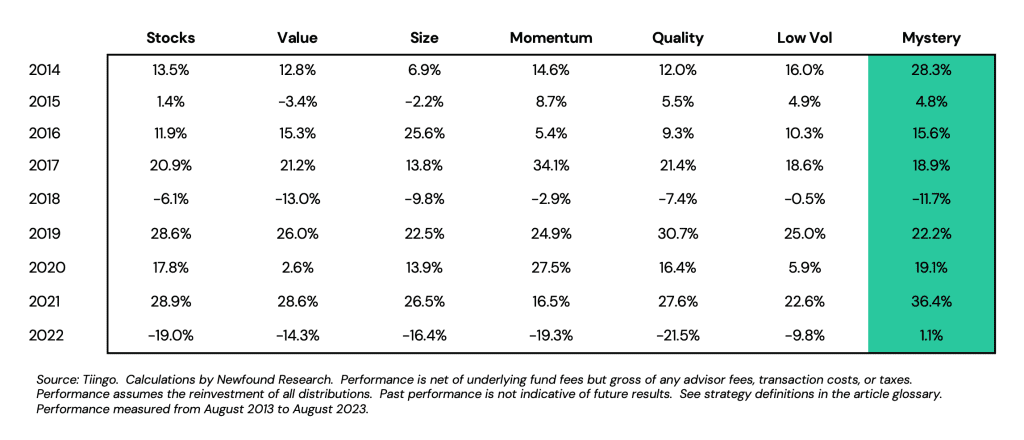
In Figure 3 we plot the annual returns of Stocks and Stocks plus the equity factor returns. In other words, we’re no longer looking at the excess returns, but the total return of the strategy. We can see that the Mystery factor has been a strong contender versus the other equity factors and provided valuable diversification in 2022 when equity markets struggled.
The Style Tilt Reveal
What is our Mystery factor? If you have been reading our other articles, you may have guessed it already: Managed Futures Trend. Or, more specifically, a 100% equity portfolio overlaid with the returns of a Managed Futures Trend strategy.
“Not fair,” you may exclaim, “that’s not an equity strategy! That doesn’t count.”
It is a fair point. In the academic literature, Managed Futures Trend certainly will not help explain the cross-section of equity returns.
Yet as practitioners, it may be wise to remember the words of Voltaire: “perfect is the enemy of good.” Managed Futures Trend does not fit perfectly into the academic factor definition, nor are its results even generated from trading individual equities! Yet if we ignore the how and simply evaluate the return stream, it would have historically made a compelling active return profile.
For investors pursuing excess returns, return stacking unlocks the opportunity to introduce novel, diversifying return streams on top of equity exposure, untethering investors from having to generate alpha from stock picking alone.
Glossary
Equities – The SPDR S&P 500 ETF Trust (SPY). Excess returns are measured against Treasury Bills.
Bonds – The iShares Core US Aggregate Bond ETF (AGG). Excess returns are measured against Treasury Bills.
Treasury Bills – The SPDR Bloomberg 1-3 Month T-Bill ETF (BIL).
Value – The iShares MSCI USA Value Factor ETF (VLUE). Excess returns are measured against Equities.
Size – The iShares Core S&P Small-Cap ETF (IJR). Excess returns are measured against Equities.
Momentum – The iShares MSCI USA Momentum Factor ETF (MTUM). Excess returns are measured against Equities.
Quality – The iShares MSCI USA Quality Factor ETF (QUAL). Excess returns are measured against Equities.
Low Volatility – The iShares MSCI USA Minimum Volatility Factor ETF (USMV). Excess returns are measured against Equities.
Mystery / Managed Futures – The Credit Suisse Managed Futures Strategy Fund (CSAIX). Excess returns are measured against Treasury Bills.


