Boosting Bond Returns: Return Stacking for Enhancing Liquidity Buckets
Overview
Learn how to optimize your retirement portfolios by enhancing intermediate-term liquidity buckets through return stacking, diversification into low-correlation strategies, and practical tools like the “twice duration minus one” rule to balance growth, liquidity, and risk.
Key Topics
Return Stacking, Intermediate-term Liquidity Bucket, Multi-asset Trend Following, Portable Alpha, Bond Returns prediction, Diversification Strategies, Retirement Portfolio Management
Introduction
Managing investments for retirement often involves balancing competing needs: generating growth to maintain purchasing power while ensuring sufficient funds are available to cover near-term expenses. One popular approach to address this challenge is the “bucketing” strategy. Bucketing1 involves segmenting a portfolio into distinct “buckets” aligned with specific time horizons and objectives.
A typical bucketing approach might involve three buckets:
- Long-Term Growth (e.g., Equities): This bucket is designed for long-term growth and typically holds higher-return, higher-risk investments like stocks. It aims to outpace inflation and build wealth over time.
- Intermediate-Term Liquidity (e.g., Bonds): This bucket serves as a bridge between short-term needs and long-term goals. It typically holds more conservative investments like intermediate-term bonds, providing a source of funds for anticipated expenses within the next few years. This is the bucket on which this blog post focuses on.
- Short-Term Needs (e.g., Cash): This bucket holds highly liquid assets like cash or Treasury bills, ensuring funds are readily available for immediate expenses and emergencies.
By segmenting the portfolio in this way, investors can potentially avoid the need to sell long-term investments at unfavorable times, such as after a market downturn. The intermediate-term liquidity bucket plays a crucial role in providing a buffer against short-term market volatility, allowing long-term investments to ride out market cycles. However, as we’ll explore, even this “safe” bucket can benefit from enhanced return potential and diversification, which is where return stacking comes in.
When evaluating fixed income’s ability to serve as an intermediate liquidity bucket, investors should carefully evaluate whether a bond-centric approach will sufficiently address their financial objectives. Future economic uncertainty and the potential for inflation both pose challenges, and even a 5% yield may not provide the necessary growth to outpace rising expected costs in the intermediate term.
For investors seeking to potentially improve their risk-adjusted returns, diversification beyond traditional bonds may be warranted. One such approach is return stacking, also referred to as portable alpha2, which involves strategically combining other asset classes with a core bond portfolio. This post will explore how return stacking using multi-asset trend following3, multi-asset futures yield4, and merger arbitrage5 can potentially enhance a portfolio’s intermediate liquidity bucket.
Predicting Bond Returns: The "Twice Duration Minus One" Rule
A key component of sound financial planning involves establishing reasonable expectations for long-term investment returns. While predicting market behavior is inherently challenging, certain tools can provide helpful guidance, particularly for bond portfolios. One such tool is the “twice duration minus one” rule.
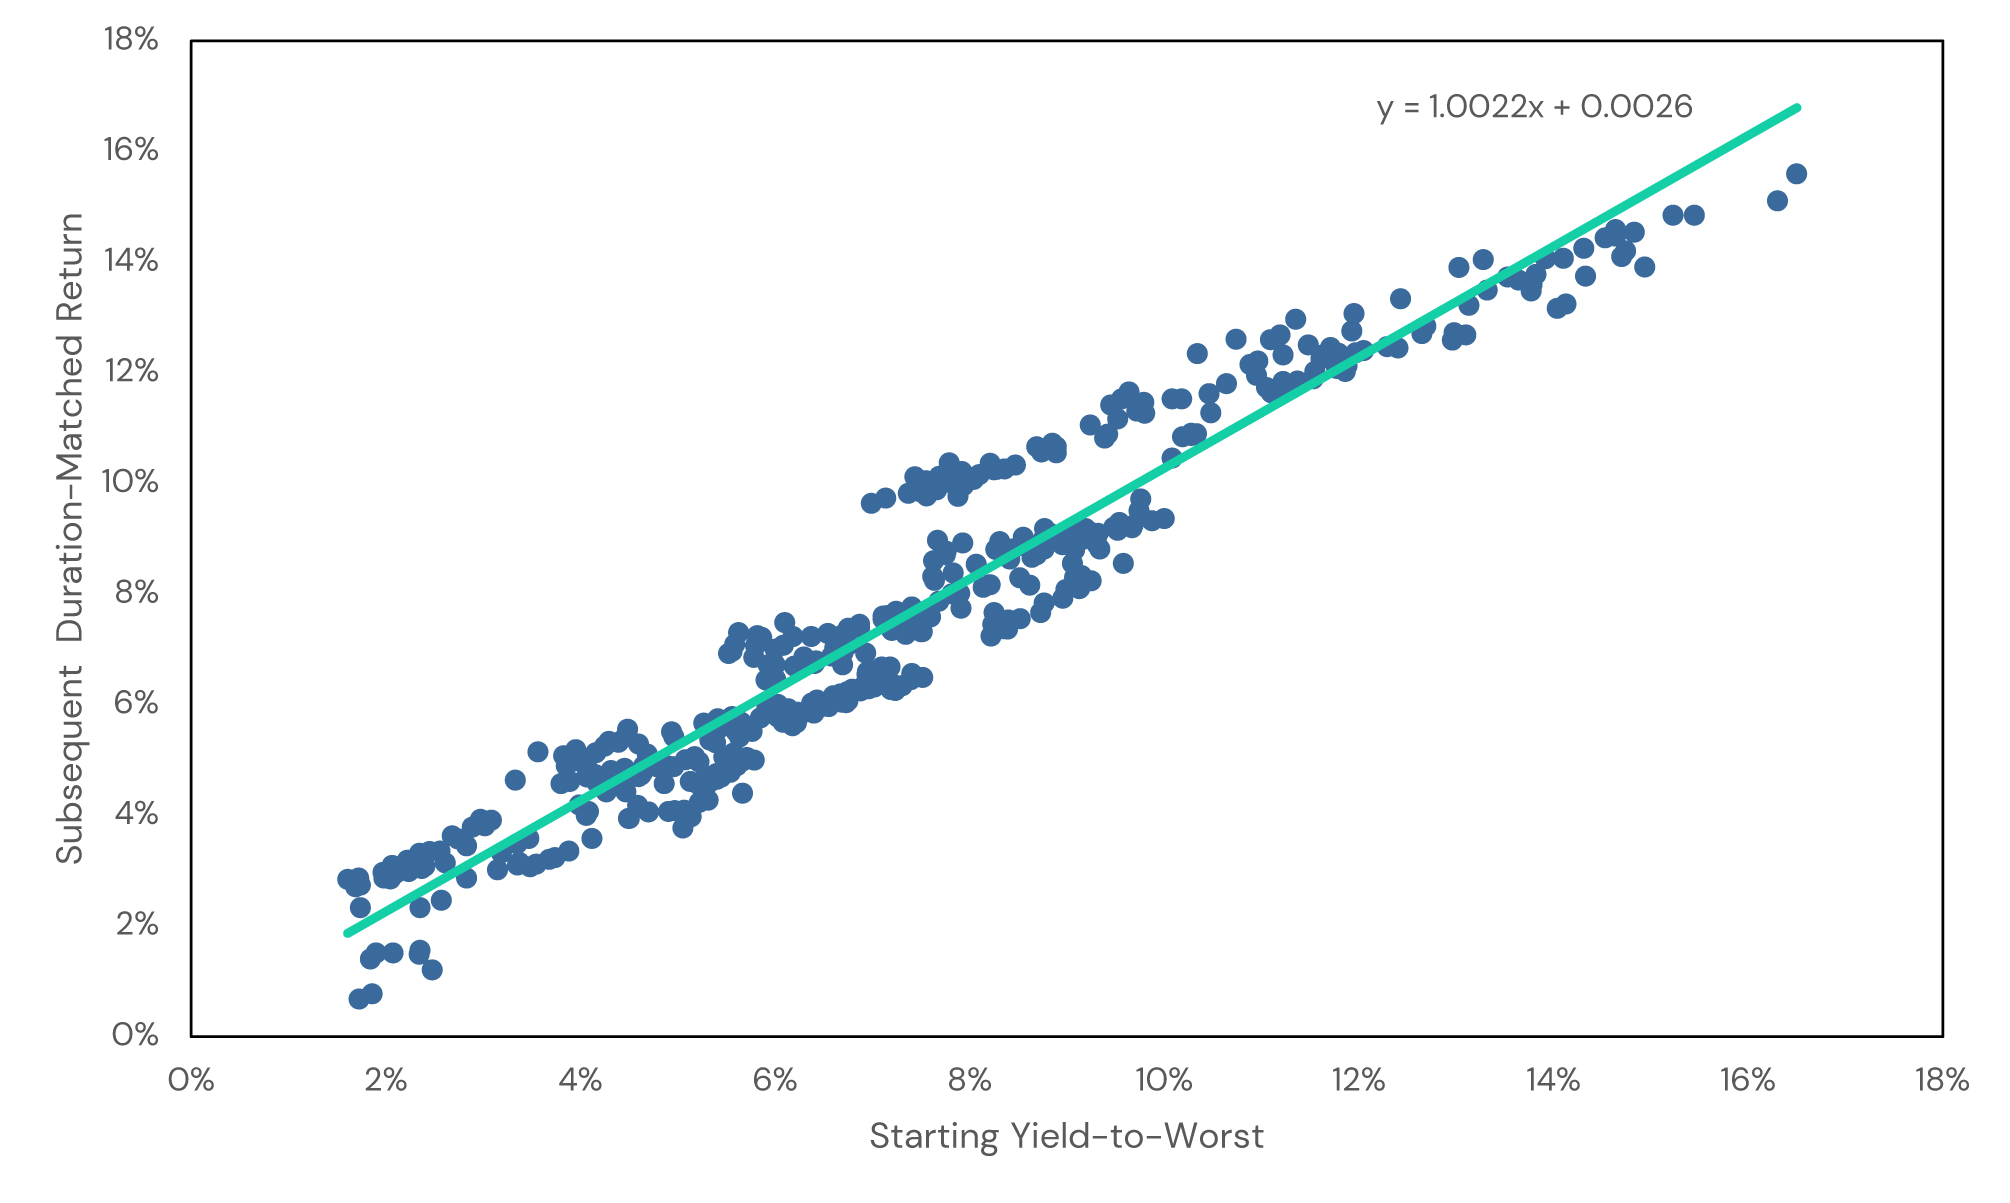
This rule suggests that the current yield-to-worst of a bond portfolio can serve as a reasonable predictor of its annualized return over a specific time horizon. This horizon is calculated as two times the portfolio’s duration minus one year. For example, a bond portfolio with a yield-to-worst of 5% and a duration of 6 years would be predicted to return approximately 5% annually over the next 11 years (6 * 2 – 1 = 11).
The underlying principle is based on the interplay between yield income and price changes due to interest rate movements. Over time, these two factors tend to offset each other, with higher yields earned in later years potentially compensating for any initial price declines caused by rising rates. Figure 1 illustrates this relationship for the Bloomberg U.S. Aggregate Bond Index.
Figure 1: Relationship Between Yield-to-Worst and Forward Effective Maturity Returns for U.S. Bonds

Source: Bloomberg. Calculations by Newfound Research. Data is from 1976 to 2023. The starting date was chosen due to data availability. For index definitions, please see Appendix A.
At the time of writing, the yield-to-worst for core U.S. Bonds was 4.7% with a duration of 6. Applying the “twice duration minus one” rule suggests a potential annualized return of approximately 4.7% over the next 11 years.
It is important to acknowledge that this rule operates under certain simplifying assumptions and has limitation. Factors such as convexity, non-parallel shifts in the yield curve, and changing duration of the underlying portfolio can influence actual returns and are not fully captured by this simplified model. Nevertheless, the “twice duration minus one” rule offers a practical framework for estimating potential bond returns over a defined horizon.
The Power of Diversification: Introducing Uncorrelated Return Streams
After establishing their intermediate investment needs, investors may recognize the potential limitations of relying solely on traditional fixed income. Diversifying beyond traditional fixed income can be a crucial step toward potentially improving risk-adjusted returns, and increasing our confidence that wealth set aside for anticipated liabilities will be sufficient. This may involve incorporating asset classes that exhibit low or negative correlations with bonds, helping to increase a portfolio’s potential to weather unexpected economic or inflation risk.
Three such asset classes to consider are multi-asset trend following, multi-asset futures yield, and merger arbitrage. Multi-asset trend following seeks to capture returns by systematically identifying and participating in sustained price trends across various global markets, including commodities, currencies, and equities. Multi-asset carry focuses on capturing the risk premium associated with holding futures contracts, often referred to as “carry” or “roll yield.”6
Finally, merger arbitrage seeks to profit from the price discrepancies that often occur in the stock market during corporate mergers and acquisitions.
Figure 2: Historical Correlations between US Bonds, Multi-Asset Trend, and Multi-Asset Carry
| US Bonds | Multi-Asset Carry | Multi-Asset Trend | Merger Arbitrage | |
| US Bonds | 1.00 | 0.02 | 0.12 | 0.14 |
| Multi-Asset Carry | 0.02 | 1.00 | -0.01 | 0.16 |
| Multi-Asset Trend | 0.12 | -0.01 | 1.00 | 0.12 |
| Merger Arbitrage | 0.14 | 0.16 | 0.12 | 1.00 |
Source: Bloomberg. Data begins in December 1999 and ends in December 2023. For index definitions, please see Appendix A.
Empirically, multi-asset trend following, multi-asset carry, and merger arbitrage have exhibited low-to-zero correlations with U.S. bonds. This lack of correlation suggests that these strategies could offer diversification benefits, reduce a portfolio’s exposure to inflation and interest rate risk, and potentially enhance risk-adjusted returns.
Register for our Advisor Center
Tools Center:
Easily backtest & explore different return stacking concepts
Model Portfolios:
Return stacked allocations, commentary and guidance designed
for a range of client risk profiles and goals
Future Thinking:
Receive up-to-date insights into the world of return stacking theory and practice
Return Stacking in Action: Building a More Attractive Intermediate-Term Liquidity Bucket
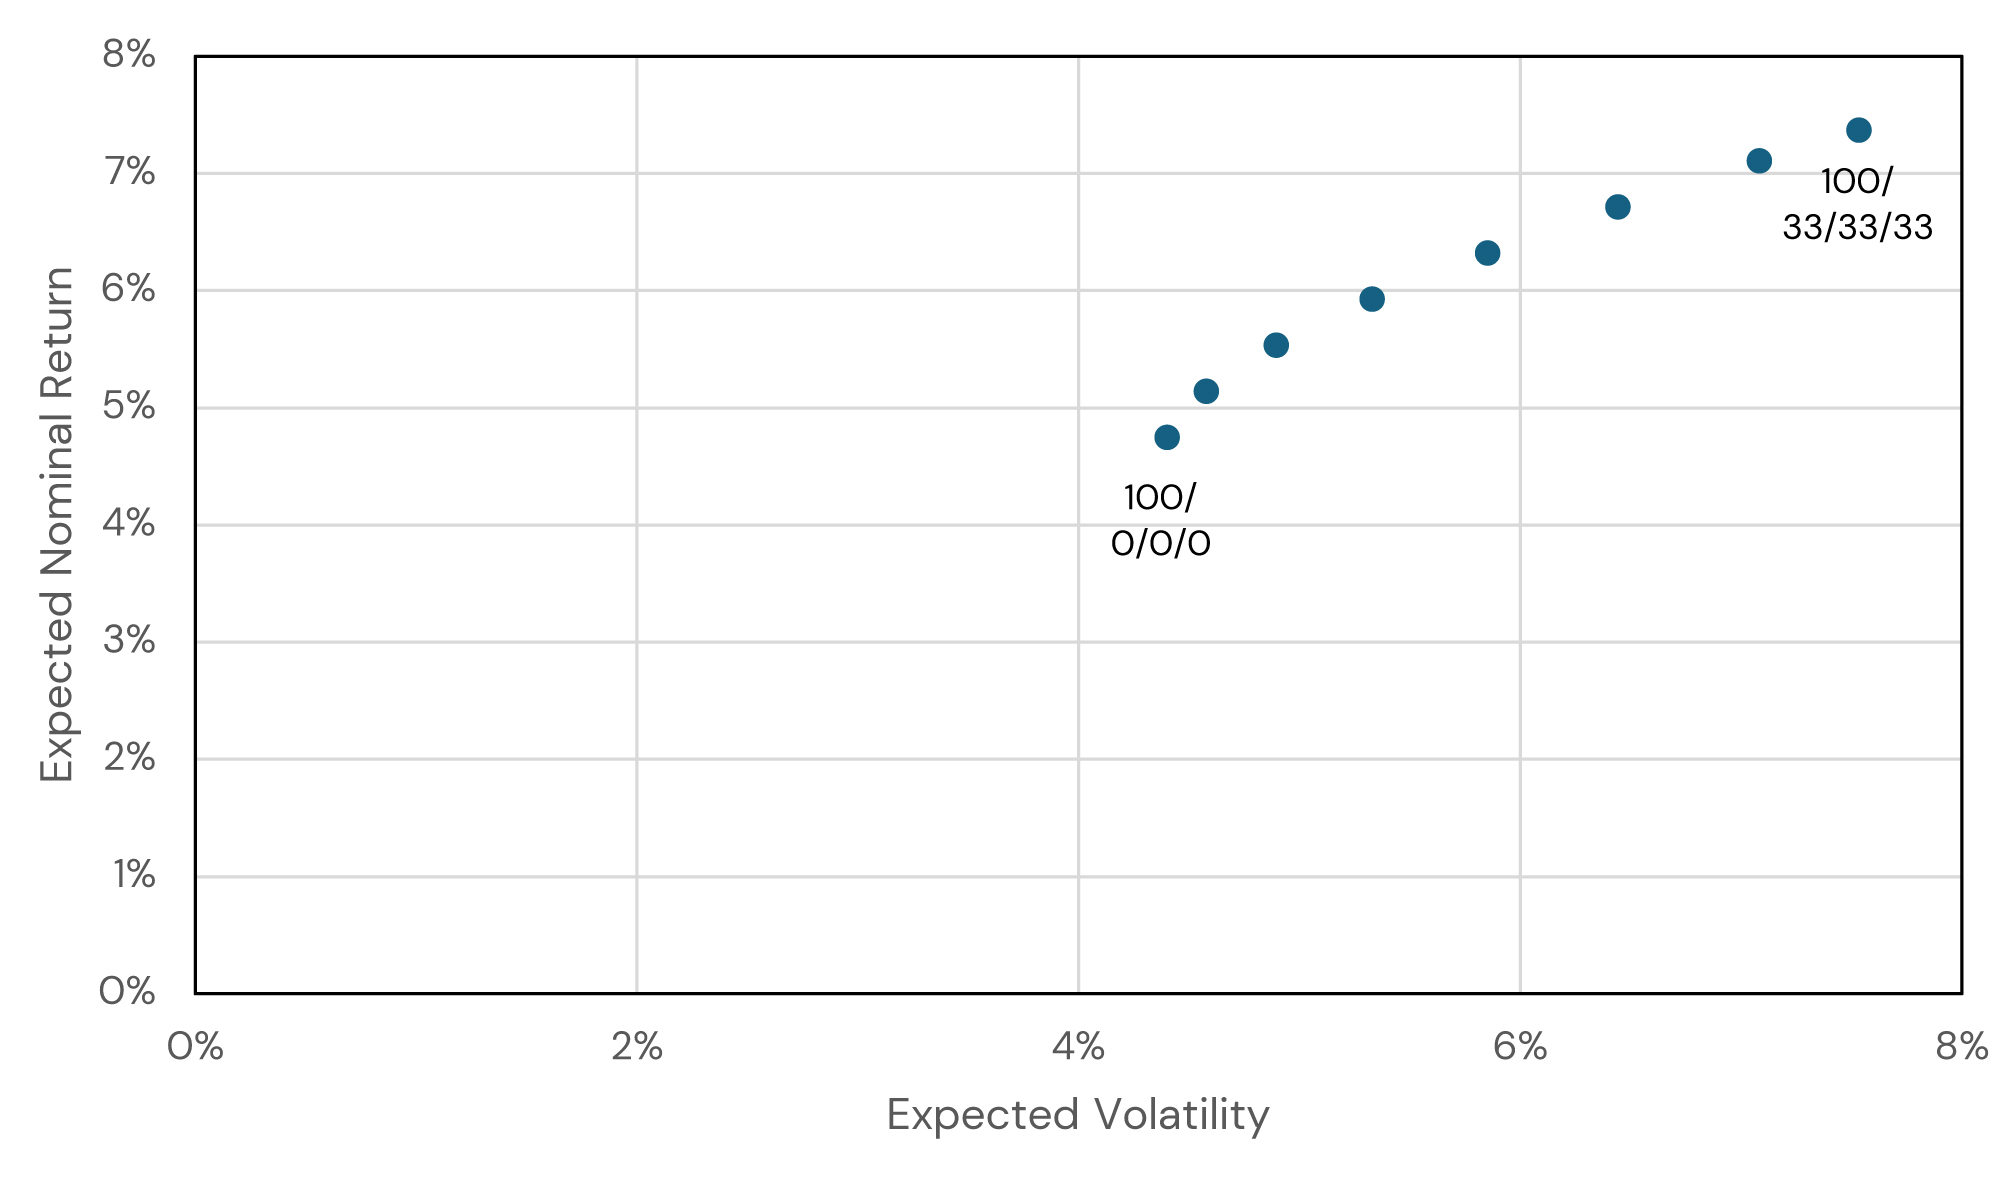
We can model the potential benefits of return stacking by comparing a traditional U.S. bond portfolio with portfolios that, in addition to the same notional 100% U.S. bond exposure, stack varying allocations of an equal-weight blend of multi-asset trend following, multi-asset carry, and merger arbitrage.
Assuming long-term Sharpe Ratios of 0.3 and respective volatilities of 12%, 10%, and 4.2% for the alternative strategies, Figure 3 illustrates the hypothetical relationship between expected return and volatility across different allocation levels (from 0% to 33%). This analysis utilizes the empirical correlations shown in Figure 2.
Figure 3: Expected Return and Expected Volatility of Return Stacked Intermediate-Term Liquidity Buckets

For illustrative purposes only. Calculations by Newfound Research. The figure assumes the following: US Bond expected returns of 4.75% and volatility of 4.4%, Multi-Asset Trend-Following expected excess returns of 3.6% and volatility of 12%, Multi-Asset Carry expected excess returns of 3% and volatility of 10%, and Merger Arbitrage expected excess return of 1.3% and volatility of 4.2%. Correlation assumptions are the same as in Figure 2.
Figure 4: Return Stacked Intermediate-Term Liquidity Bucket Expectations
| US Bonds / Multi-Asset Trend-Following / Multi-Asset Carry / Merger Arbitrage Portfolios | ||||||||
| 100/ 0/0/0 |
100/ 5/5/5 |
100/ 10/10/10 |
100/ 15/15/15 |
100/ 20/20/20 |
100/ 25/25/25 |
100/ 30/30/30 |
100/ 33/33/33 |
|
| Expected Return | 4.8% | 5.1% | 5.5% | 5.9% | 6.3% | 6.7% | 7.1% | 7.4% |
| Expected Volatility | 4.4% | 4.6% | 4.9% | 5.4% | 5.9% | 6.6% | 7.3% | 7.8% |
| Sharpe Ratio (Rf = 0) |
1.08 | 1.13 | 1.13 | 1.10 | 1.06 | 1.02 | 0.97 | 0.94 |
For illustrative purposes only. Calculations by Newfound Research. The figure assumes the following: US Bond expected returns of 4.75% and volatility of 4.4%, Multi-Asset Trend-Following expected excess returns of 3.6% and volatility of 12%, Multi-Asset Carry expected excess returns of 3% and volatility of 10%, and Merger Arbitrage expected excess return of 1.3% and volatility of 4.2%. Correlation assumptions are the same as in Figure 2.
The Return Stacking landscape is ever evolving, go deeper by connecting with a team member.
Conclusion: Rethinking the Intermediate Liquidity Bucket
Even when rates are considered ‘reasonable’, inflation and market risk factors mean investors seeking to balance liquidity needs with growth face a challenging dilemma. When rising bond yields offer a welcome reprieve from a “lower-for-longer” era, relying solely on fixed income for intermediate-term liquidity may still fall short of meeting cashflow obligations when optimizing for long-term financial goals.
As we’ve explored, return stacking—the strategic combination of a core bond portfolio with non-dilutive uncorrelated strategies such as multi-asset trend following and multi-asset futures yield—offers a potential solution. By diversifying beyond traditional bonds, investors may be able to enhance returns, mitigate certain risks, and potentially improve the overall resilience of their intermediate liquidity bucket. The potential benefits of inflation protection and macroeconomic diversification further strengthen the case for considering this approach.
The decision of whether a bond-only strategy is “enough” ultimately depends on individual circumstances, goals, and risk tolerance. However, for those seeking to navigate the complexities of today’s market landscape (and potentially enhance the performance of their intermediate-term investments) return stacking warrants consideration.
Appendix A:
- US Bonds: The Bloomberg US Agg Total Return Value Unhedged USD index (Bloomberg ticker: LBUSTRUU).
- Multi-Asset Trend-Following: The SG CTA Trend Index (Bloomberg ticker: NEIXCTAT) The SG Trend Index is equal-weighted and reconstituted annually. The index calculates the net daily rate of return for a pool of trend following based hedge fund managers. Excess returns are measured against 1-3 month U.S. Treasury Bills.
- Multi-Asset Futures Yield: The Bloomberg GSAM Cross Asset Carry Index (Bloomberg ticker: BGSXAC) rescaled to an ex-ante 10% annualized volatility.
- Merger Arbitrage: The Credit Suisse Liquid Alternative Beta Merger Arbitrage Liquid Index (Bloomberg Ticker: CSLABMA). The Credit Suisse Merger Arbitrage Liquid Index seeks to gain broad exposure to the Merger Arbitrage strategy by using a pre-defined quantitative methodology in order to invest in a liquid, diversified and broadly representative set of announced merger deals.
1 https://www.kitces.com/blog/managing-sequence-of-return-risk-with-bucket-strategies-vs-a-total-return-rebalancing-approach/
2 https://www.returnstacked.com/portable-alpha/
3 https://www.returnstacked.com/managed-futures-trend-following/
4 https://www.returnstacked.com/managed-futures-yield-carry/
5 https://www.returnstacked.com/merger-arbitrage/
6 We’ve covered trend-following and carry in detail in a dedicated webinar. Watch it here.

