Carry the Yield, Ride the Trend: A Strategic Partnership
Overview
With unfavorable shifts in stock/bond correlations and elusive risk premia, traditional portfolio strategies face challenges. Trend following and carry, proven macro approaches, reveal their true strength when integrated, offering investors a resilient, diversified return profile for today’s complexities.
Key Topics
Return Stacking, Managed Futures, Yield, Tend & Carry Synergy
Table of Contents
Extracting Different Information: Trend vs. Carry
Understanding Trend Following and Carry Strategies
Correlation and Diversification Benefits
Overcoming Behavioral and Structural Hurdles with Return Stacking
Performance Analysis: Validating the Yes AND Solution
Introduction
In an era defined by fluid macro regimes and shifting correlations, the old playbook for portfolio construction is showing its age. As major asset classes increasingly move in lockstep and orthodox risk premia seem more elusive than ever, advisors are compelled to seek new sources of stability and diversification. Against this backdrop, two systematic macro approaches—trend following and carry—have long demonstrated their mettle, each illuminating a unique facet of market behavior and each rooted in decades of compelling evidence. Yet their true power emerges when they’re thoughtfully integrated into a single portfolio and ‘stacked’ as portable alphas. By blending these complementary strategies, and understanding how trend following and carry strategies extract distinct market information, advisors can potentially enhance their portfolios, achieve more stable performance, and better navigate the inevitable storms that financial markets present.
Foundations of Systematic Macro Strategies
Decomposing Asset Returns
At their most basic level, asset returns can be decomposed into two primary components:
- Price Appreciation/Depreciation: Gains or losses stemming from changes in an asset’s price.
- Yield or Carry: Returns derived from the asset’s “income component,” such as dividends for equities, interest rates for bonds and currencies, or storage and convenience yields in commodities.
Trend following strategies focus predominantly on persistent price moves, seeking to capture sustained upward or downward trends. Carry strategies, on the other hand, concentrate on yield differentials embedded in asset prices, effectively harvesting risk premia that compensate investors for bearing certain economic, liquidity, or credit risks. Carry Tends to be the second most favored strategy implemented in CTA funds next to Trend.
Figure 1. Percent of Managers in the Société Générale CTA Index Referencing Investment Styles
Source: Newfound Research. Numbers are best estimates based upon publicly available data. Data sources are available upon request. At the time of publication, managers within the Société Générale CTA Index include major systematic macro firms.
Together, these two approaches cover a broad swath of return sources, extracting different types of information from the same global markets. This complementary nature fosters natural diversification, as one strategy may succeed when the other lags, and vice versa.
Global Diversification and the Role of Futures
Both trend and carry strategies typically draw from a global opportunity set, spanning dozens of markets in global equities, global bonds, currencies, and commodities.
This breadth of market coverage ensures that regardless of the prevailing economic conditions—rising inflation, recessionary cycles, commodity booms, or sovereign debt crises—both trend and carry strategies may find profitable opportunities. Their systematic, rules-based approaches utilize futures contracts, providing capital efficiency, liquidity, and a standardized framework for risk management.
Systematic Advantages
Systematic approaches remove much of the emotional and behavioral biases that can hamper discretionary investment decisions. By adhering to clearly defined rules, systematic managers implement disciplined execution and risk management protocols, ensuring that strategies are both scalable and transparent. This disciplined ethos is critical, particularly during volatile periods when emotions run high and human judgment is prone to error.
Extracting Different Information: Trend vs. Carry
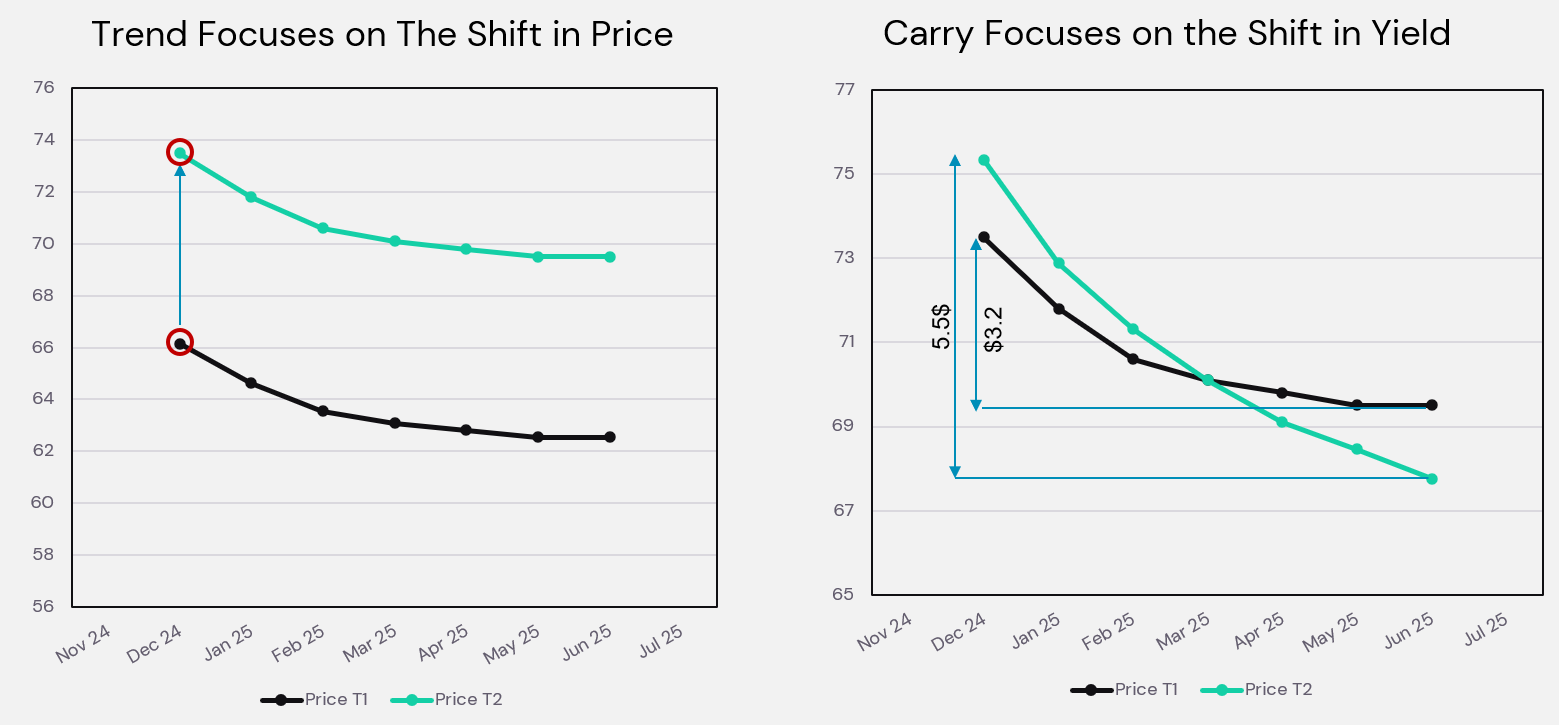
The interplay of trend and carry emerges from their focus on different dimensions of market data. Trend following strategies emphasize historical price patterns and seek to profit from market momentum. Carry strategies, in contrast, look at term structures, yield curves, and interest rate differentials to identify assets offering higher expected returns if conditions remain stable.
Figure 2. Trend and Carry Analysis: Different Market Information Extraction
For illustrative purposes only
Understanding Trend Following and Carry Strategies
Trend Following Mechanics
Trend following rests on the belief that markets exhibit persistent directional moves. By analyzing price data over multiple lookback periods—short, medium, and long horizons—trend strategies aim to identify patterns of sustained appreciation or depreciation. During extended bull markets, these strategies tend to hold long positions, while in bear markets they may rotate into short positions, potentially offering “crisis alpha” during downturns.
Carry Strategy Implementation
Carry strategies focus on the yield or income component embedded in asset prices. For example:
- In equities, dividends represent a form of carry.
- In bonds, yield premia compensate investors for various risks such as inflation and credit exposure.
- In currencies, interest rate differentials drive the profitability of a carry trade.
- In commodities, storage costs and convenience yields shape the forward curve, offering opportunities to earn carry.
Because these premia compensate investors for bearing certain risks, carry strategies tend to be rewarded over time.
Theoretical Foundations
Trend Following:
- Risk-Based Explanation: Trend followers provide liquidity to natural hedgers in stressed markets, earning a risk premium.
- Behavioral Explanation: Anchoring, herding, and information cascades cause slow diffusion of new information, enabling trends to persist.
- Structural Inefficiencies: Market microstructure effects, order execution delays, and institutional constraints can create predictable price drifts.
Carry Strategies:
- Risk-Based Explanation: In each asset class, carry measures capture some element of fundamental risk. In equities, dividend yields reflect fundamental risk compensation. In bonds, yield differentials compensate for credit, liquidity, monetary, and inflation risks. In commodities, convenience yields arise from storage costs, scarcity, and producer hedging demand. In currencies, interest rate differentials reward bearing funding liquidity and cross-border flow. bonds, yield differentials compensate for credit, liquidity, monetary, and inflation risks.
Register for our Advisor Center
Tools Center:
Easily backtest & explore different return stacking concepts
Model Portfolios:
Return stacked allocations, commentary and guidance designed
for a range of client risk profiles and goals
Future Thinking:
Receive up-to-date insights into the world of return stacking theory and practice
Correlation and Diversification Benefits
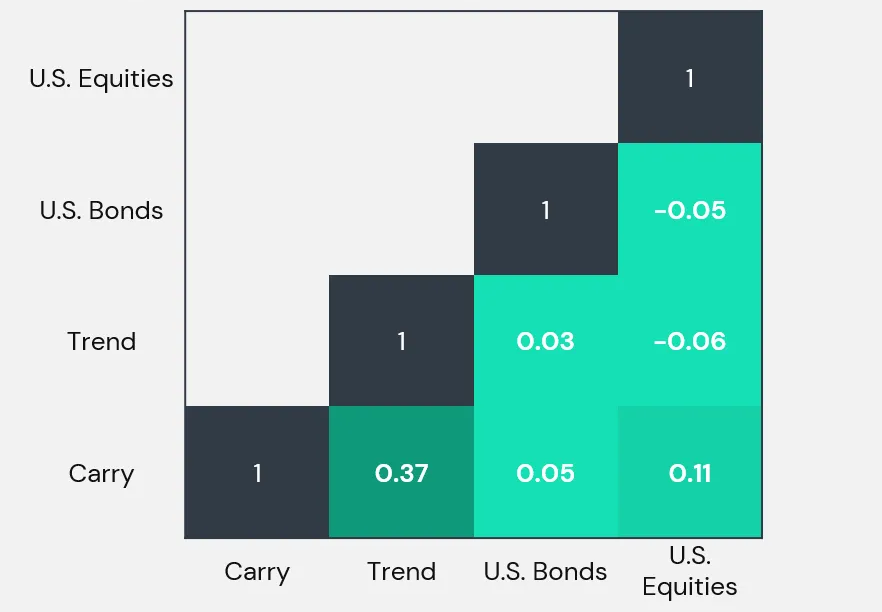
Combining trend and carry exploits their distinct sources of returns. By tapping into different risk premia and focusing on complementary aspects of the market, a blend of these strategies often exhibits lower correlation to traditional investments—especially during crises.
Figure 3. Daily Correlations - Jan 1, 2000 to Dec 31, 2023
Source: ReSolve Asset Management Inc., Tiingo and Société Générale. Analysis by ReSolve Asset Management SEZC (Cayman). Trend is the Société Générale Trend Index (“NEIXCTAT”), an index designed to track the largest trend following commodity trading advisors (“CTAs”) in the managed futures space net of underlying fees. Carry is index data based on HYPOTHETICAL returns from Butler, A.D. & Butler A. (2014), Managed Futures Carry: a Practitioners Guide. U.S. Equities is the S&P 500 Total Return Index (“SPXT”). U.S. Bonds is the Bloomberg U.S. Aggregate Bond Index (“LBUSTRUU”). Returns for both U.S. Equities and U.S. Bonds are gross of all fees. You cannot invest in an index. Please see glossary at the end of this presentation for index definitions. Returns assume the reinvestment of all distributions and are gross of taxes. Period is 12/31/1999 through 12/31/2023. The starting date is chosen based upon the earliest date data is available for the underlying indexes. Please read full disclaimer on hypothetical performance at the end of this presentation. Past performance is not indicative of future results.
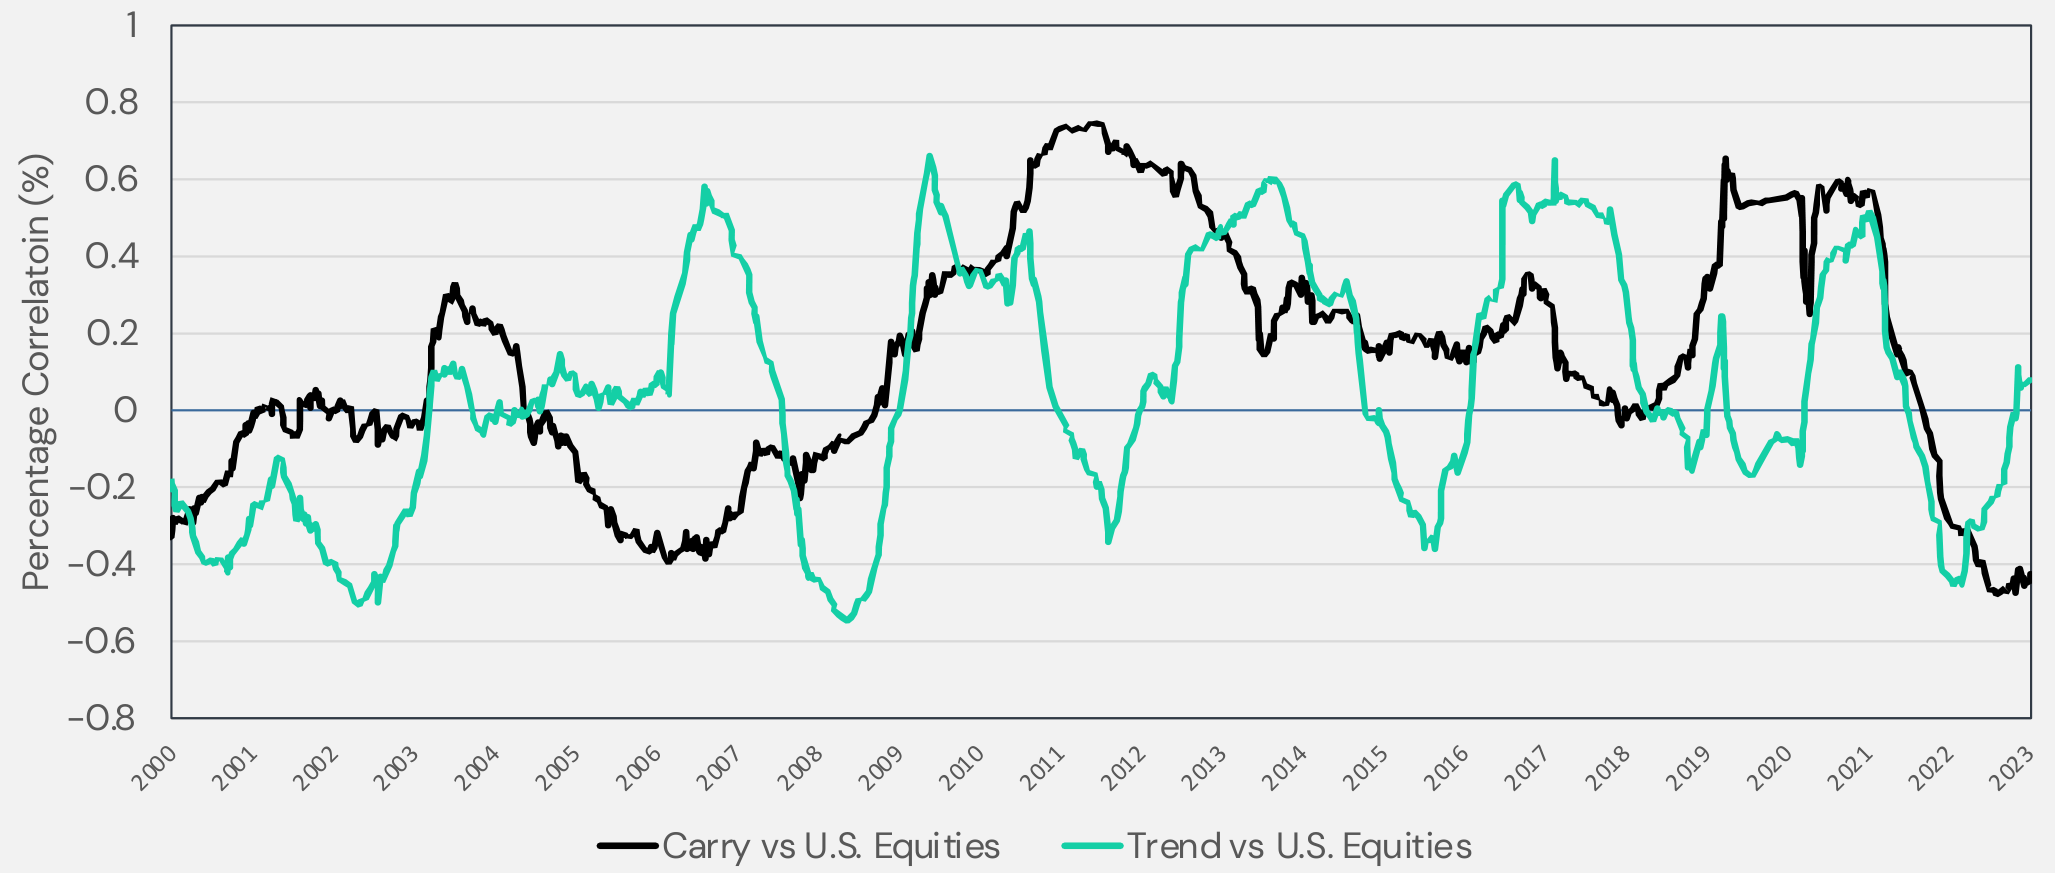
As with most directional strategies, correlations are not static: they evolve. Sometimes these strategies become negatively correlated with equities, delivering much-needed diversification, while at other times correlations drift positive. Rather than seeking a permanent safe haven, the goal is to identify strategies that can adapt as market conditions change.
Figure 4. Rolling Correlations vs. U.S. Equities
Source: ReSolve Asset Management Inc., Tiingo and Société Générale. Analysis by ReSolve Asset Management SEZC (Cayman). Trend is the Société Générale Trend Index (“NEIXCTAT”), an index designed to track the largest trend following commodity trading advisors (“CTAs”) in the managed futures space net of underlying fees. Carry is index data based on HYPOTHETICAL returns from Butler, A.D & Butler A. (2014), Managed Futures Carry: a Practitioners Guide. U.S. Equities is the S&P 500 Total Return Index (“SPXT”). Returns for U.S. Equities are gross of all fees. You cannot invest in an index. Please see glossary at the end of this presentation for index definitions. Returns assume the reinvestment of all distributions and are gross of taxes. Period is 12/31/1999 through 12/31/2023. The starting date is chosen based upon the earliest date data is available for the underlying indexes. Please read full disclaimer on hypothetical performance at the end of this presentation. Past performance is not indicative of future results.
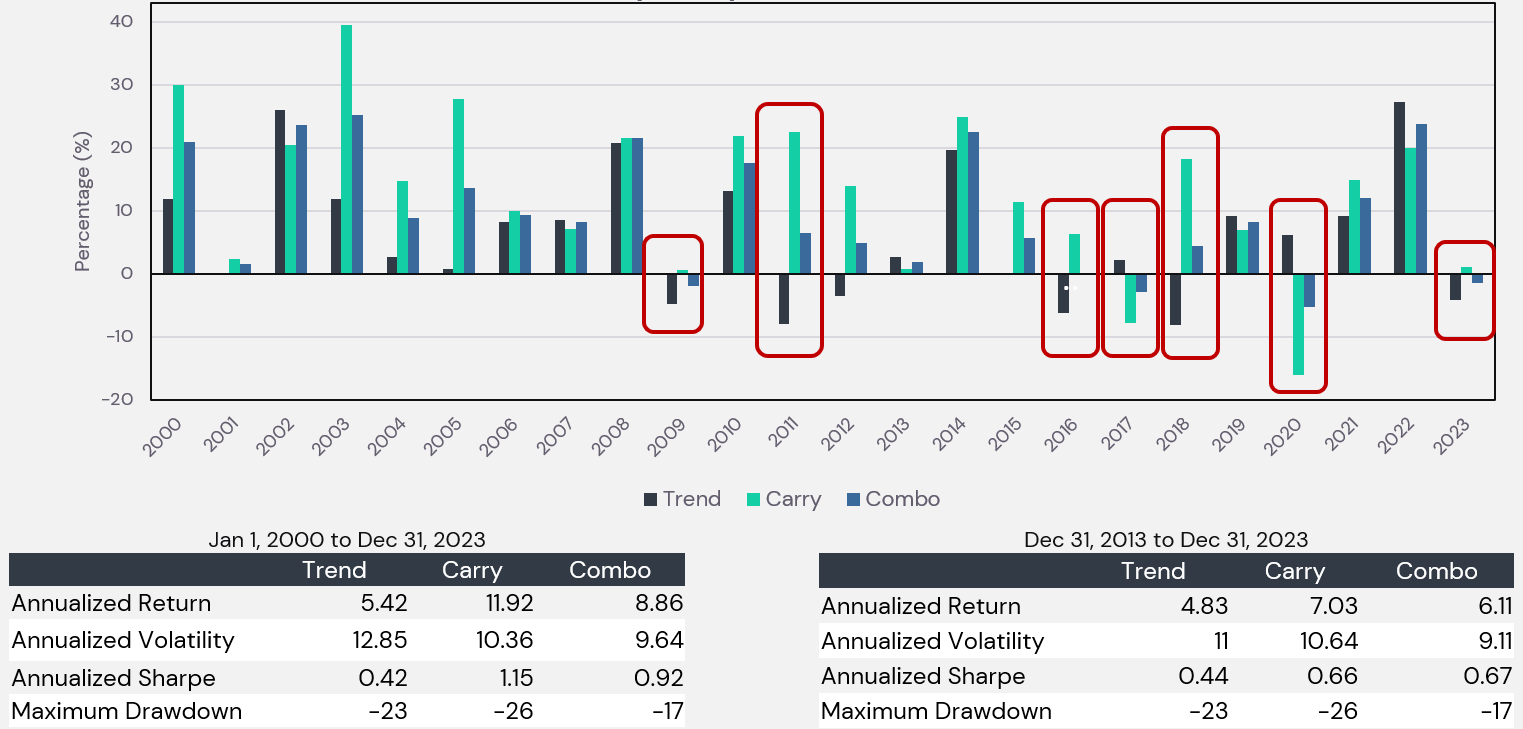
When examining calendar year returns we note:
- Most years show positive strategy returns
- There has not been a calendar year where trend and carry had negative returns concurrently
- The equal weight combination reduced the amount of years that an investor would have suffered a negative calendar year return.
One important observation is the fact that we can observe a marked drop in Sharpe ratio for carry from 2014 onward. We suspect a large reason for this was the publication of a seminal paper titled “Carry” by Ralph S. J. Koijen, Tobias J. Moskowitz, Lasse Heje Pedersen, and Evert B. Vrugt, published in August 2013, which provided the incentive for many allocators to crowd into this risk premia. Regardless, given the risk risk-based nature of this premia we believe that it will always command a positive Sharpe ratio similar to that of the one observed post 2013, which is also in line with observed trend strategy Sharpe ratios.
Figure 5. Trend and Carry Yearly Returns - HYPOTHETICAL RESULTS
Source: ReSolve Asset Management Inc., Tiingo and Société Générale. Analysis by ReSolve Asset Management SEZC (Cayman). Trend is the Société Générale Trend Index (“NEIXCTAT”), an index designed to track the largest trend following commodity trading advisors (“CTAs”) in the managed futures space net of underlying fees. Carry is index data based on HYPOTHETICAL returns from Butler, A.D & Butler A. (2014), Managed Futures Carry: a Practitioners Guide. Combo is a HYPOTHETICAL portfolio made up of 50% Trend and 50% Carry, rebalanced daily. You cannot invest in an index. Returns assume the reinvestment of all distributions and are gross of taxes. Period is 12/31/1999 through 12/31/2023. The starting date is chosen based upon the earliest date data is available for the underlying indexes. Please see glossary at the end of this presentation for index definitions. Please read full disclaimer on hypothetical performance at the end of this presentation. Past performance is not indicative of future results.
Analysis Prep
For this analysis we will be using the SocGen Trend Index as a representative index for the trend industry as a whole. Given that there is no commonly sighted index for carry strategies that we are aware of, we used the carry strategy data series as described in Butler, A.D. & Butler, A. (2024), Managed Futures Carry: a Practitioners Guide. Some key highlights of this carry implementation are:
- Not just cross-sectional carry but also time-series carry
- Allows for conditional correlation, similar to trend
- Targets 10% volatility
- Index Data ends in January 2024 so analysis will be up to December 2023
- Net of all trading costs
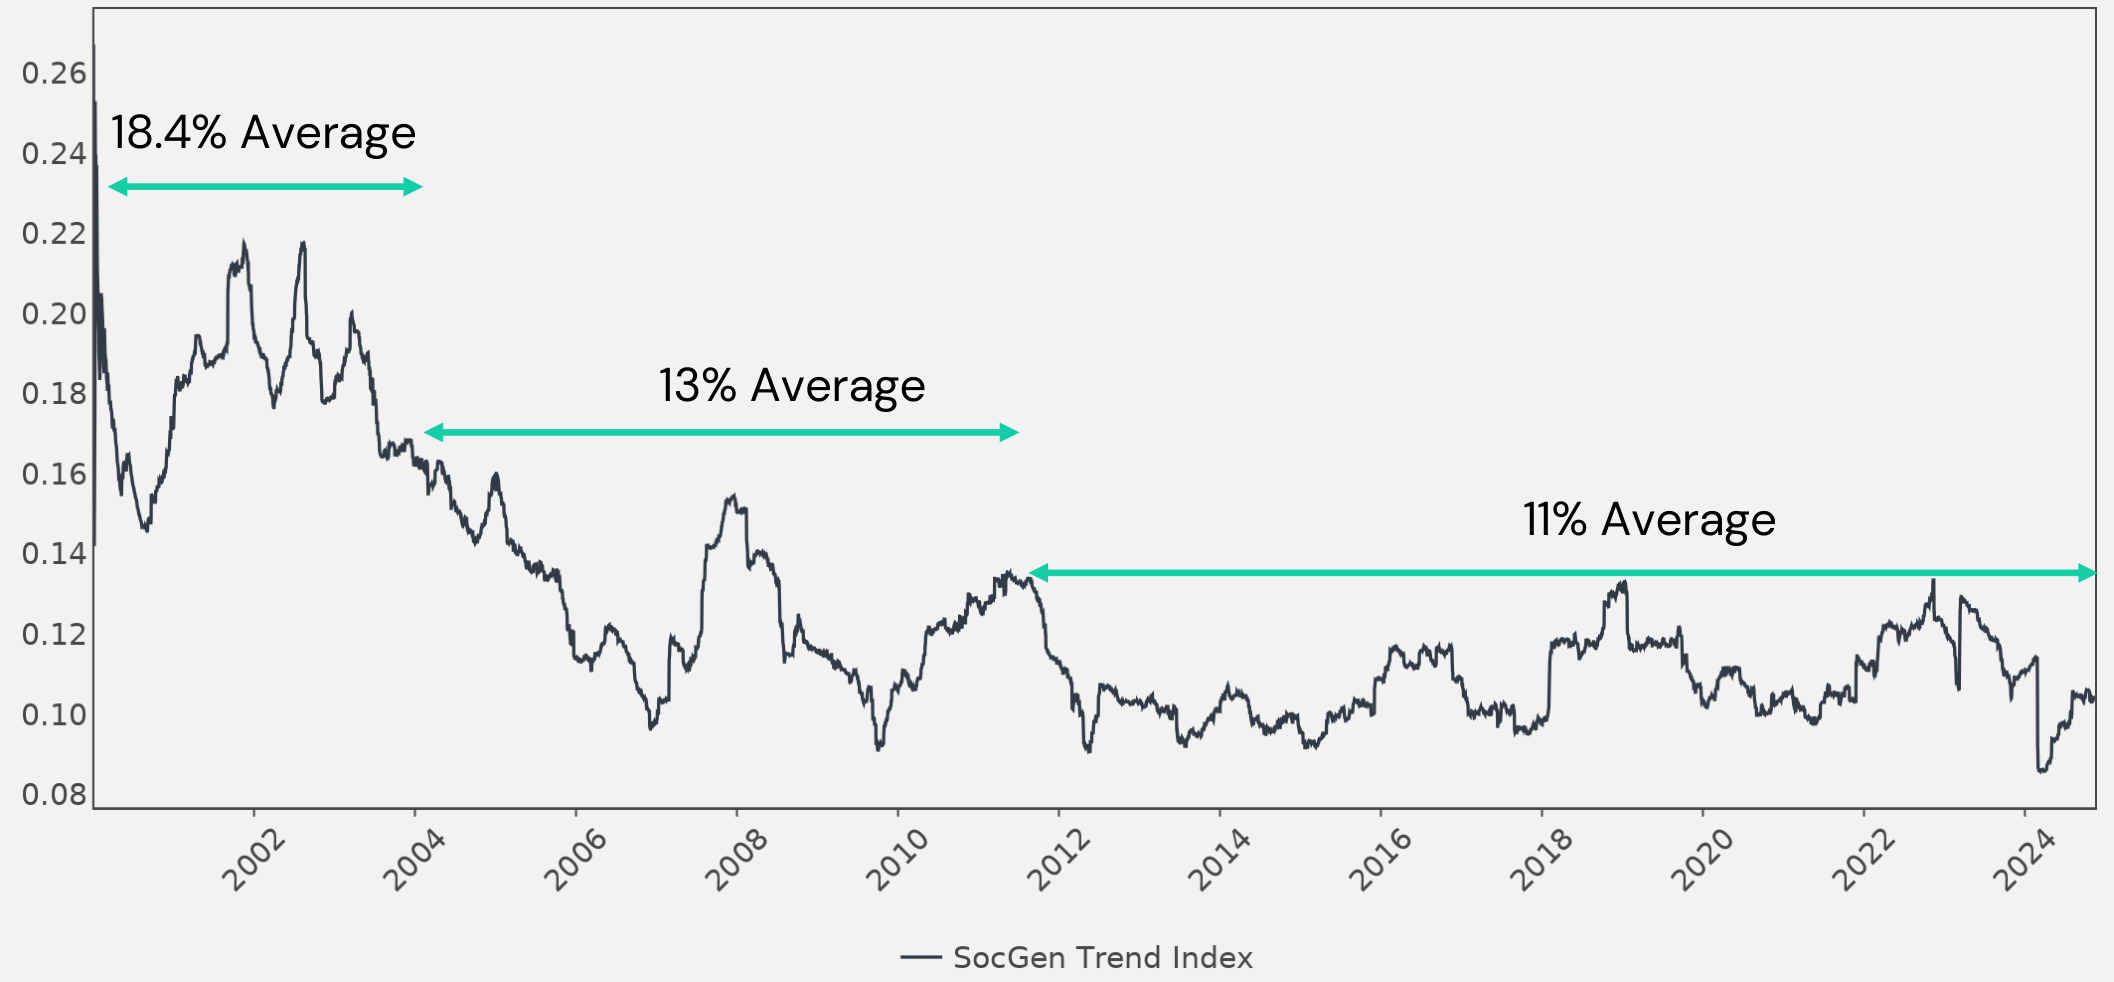
Furthermore, from a risk management perspective, in order to get a true sense of how effective a carry strategy could be during market downturns when compared to trend we have to recognize that the volatility profile of the SocGen Trend Index has evolved over time. We can observe three phases. The first is in the early 2000s, then in mid 2000s and finally post GFC where average index volatility hovered around 18.4%, 13% and 11% respectively. Given that the carry strategy targets 10% volatility, the analysis below scales carry volatility to match that of the trend index during the economic downturns examined in the past three decades.
Figure 6. Evolution of Volatility in the CTA Trend Industry
Source: Société Générale. Société Générale Trend Index (“NEIXCTAT”), an index designed to track the largest trend following commodity trading advisors (“CTAs”) in the managed futures space net of underlying fees. You cannot invest in an index. Please see glossary at the end of this presentation for index definitions. Returns assume the reinvestment of all distributions and are gross of taxes. Period is 12/31/1999 through 11/25/2024. The starting date is chosen based upon the earliest date data is available for the underlying indexes. Past performance is not indicative of future results.
This structural evolution underscores the adaptive nature of systematic strategies and the importance of active risk management.
Performance During Stress Periods
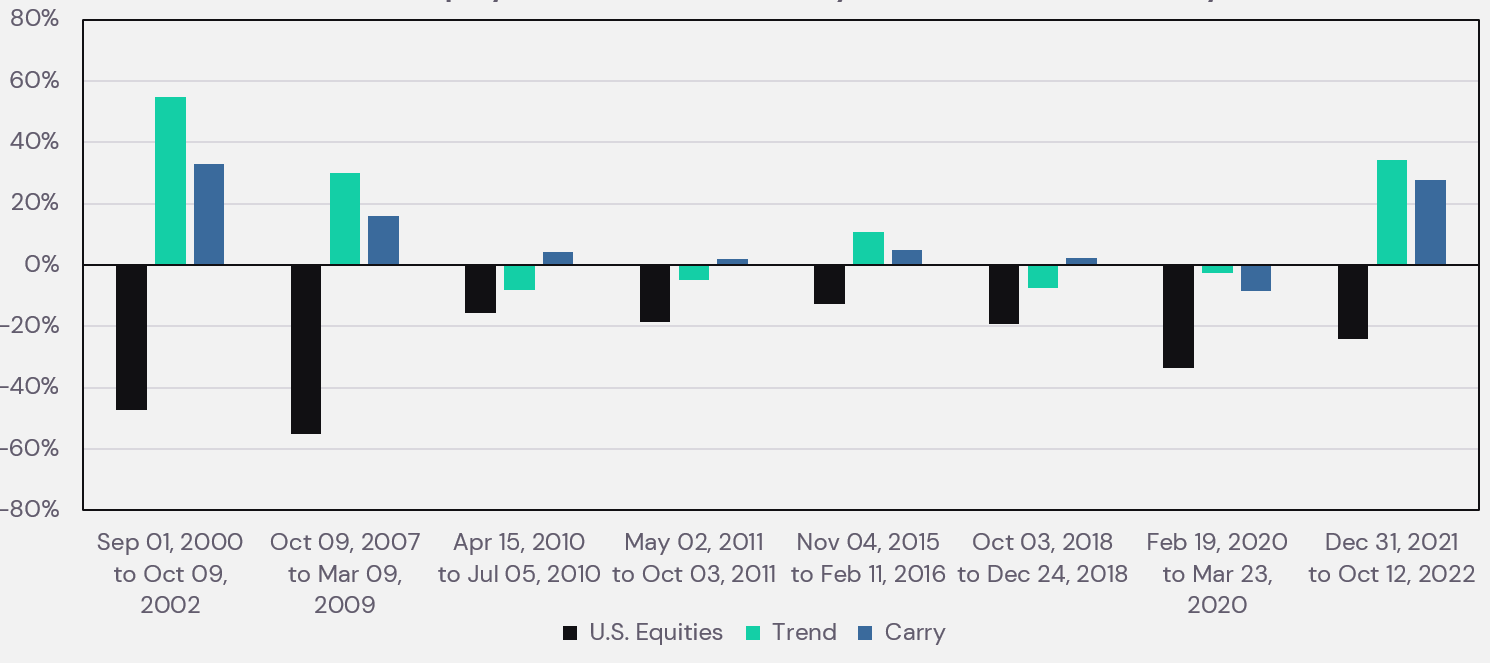
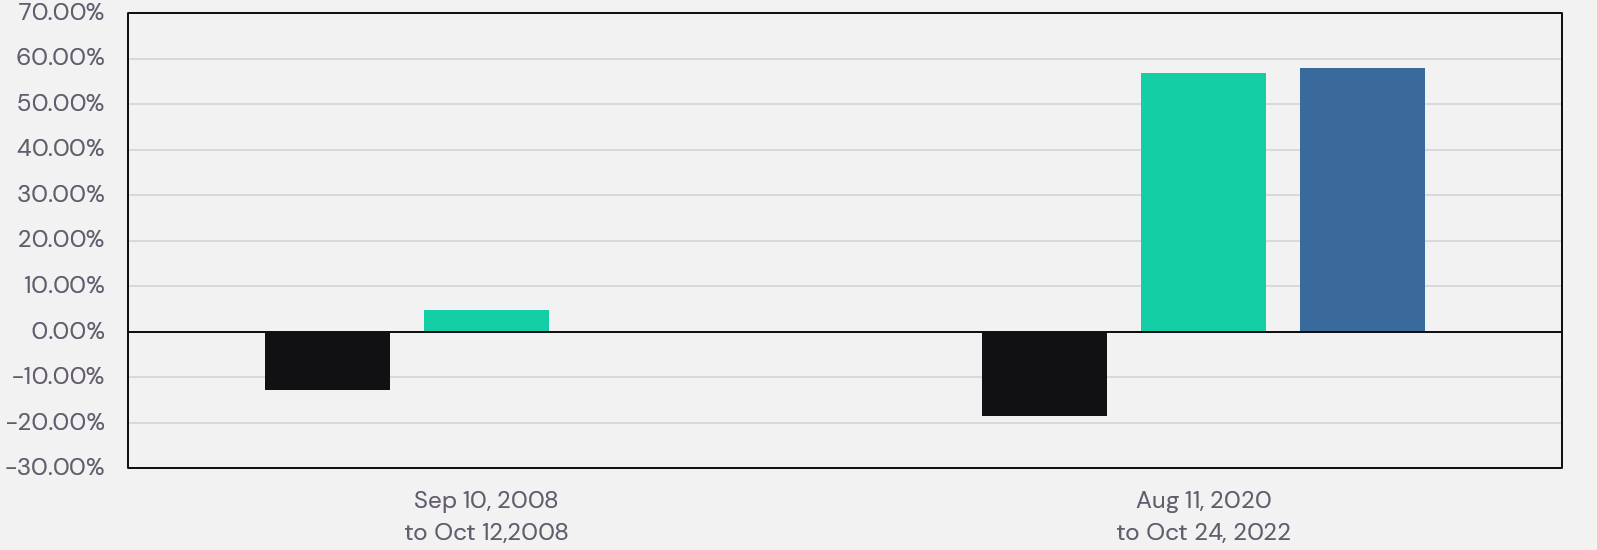
Empirical evidence shows that both carry and trend have historically provided meaningful protection during prolonged equity and bond market drawdowns. and mixed results during shorter and more abrupt market corrections.
Figure 7. Performance During Equity Market Stress
Source: ReSolve Asset Management Inc., Tiingo and Société Générale. Analysis by ReSolve Asset Management SEZC (Cayman). Trend is the Société Générale Trend Index (“NEIXCTAT”), an index designed to track the largest trend following commodity trading advisors (“CTAs”) in the managed futures space net of underlying fees. Carry is index data based on HYPOTHETICAL returns from Butler, A.D. & Butler, A. (2014), Managed Futures Carry: a Practitioners Guide. U.S. Equities is the S&P 500 Total Return Index (“SPXT”). Returns for U.S. Equities are gross of all fees. You cannot invest in an index. Please see glossary at the end of this presentation for index definitions. Returns assume the reinvestment of all distributions and are gross of taxes. Period is 12/31/1999 through 12/31/2023. The starting date is chosen based upon the earliest date data is available for the underlying indexes. Please read full disclaimer on hypothetical performance at the end of this presentation. Past performance is not indicative of future results.
Figure 8. Performance During Bond Market Stress
Source: ReSolve Asset Management Inc., Tiingo and Société Générale. Analysis by ReSolve Asset Management SEZC (Cayman). Trend is the Société Générale Trend Index (“NEIXCTAT”), an index designed to track the largest trend following commodity trading advisors (“CTAs”) in the managed futures space net of underlying fees. Carry is index data based on HYPOTHETICAL returns from Butler, A.D & Butler A. (2014), Managed Futures Carry: a Practitioners Guide. U.S. Bonds is the Bloomberg U.S. Aggregate Bond Index (“LBUSTRUU”). Returns for U.S. Bonds are gross of all fees. You cannot invest in an index. Please see glossary at the end of this presentation for index definitions. Returns assume the reinvestment of all distributions and are gross of taxes. Period is 12/31/1999 through 12/31/2023. The starting date is chosen based upon the earliest date data is available for the underlying indexes. Please read full disclaimer on hypothetical performance at the end of this presentation. Past performance is not indicative of future results.
These figures show that contrary to the simplistic narrative that carry strategies fail during crises, a diversified, cross-asset carry approach can complement trend following in times of stress. The blended portfolio can thereby mitigate drawdowns and stabilize returns when traditional assets falter.
Overcoming Behavioral and Structural Hurdles with Return Stacking
The “Funding Problem” in Portfolio Construction
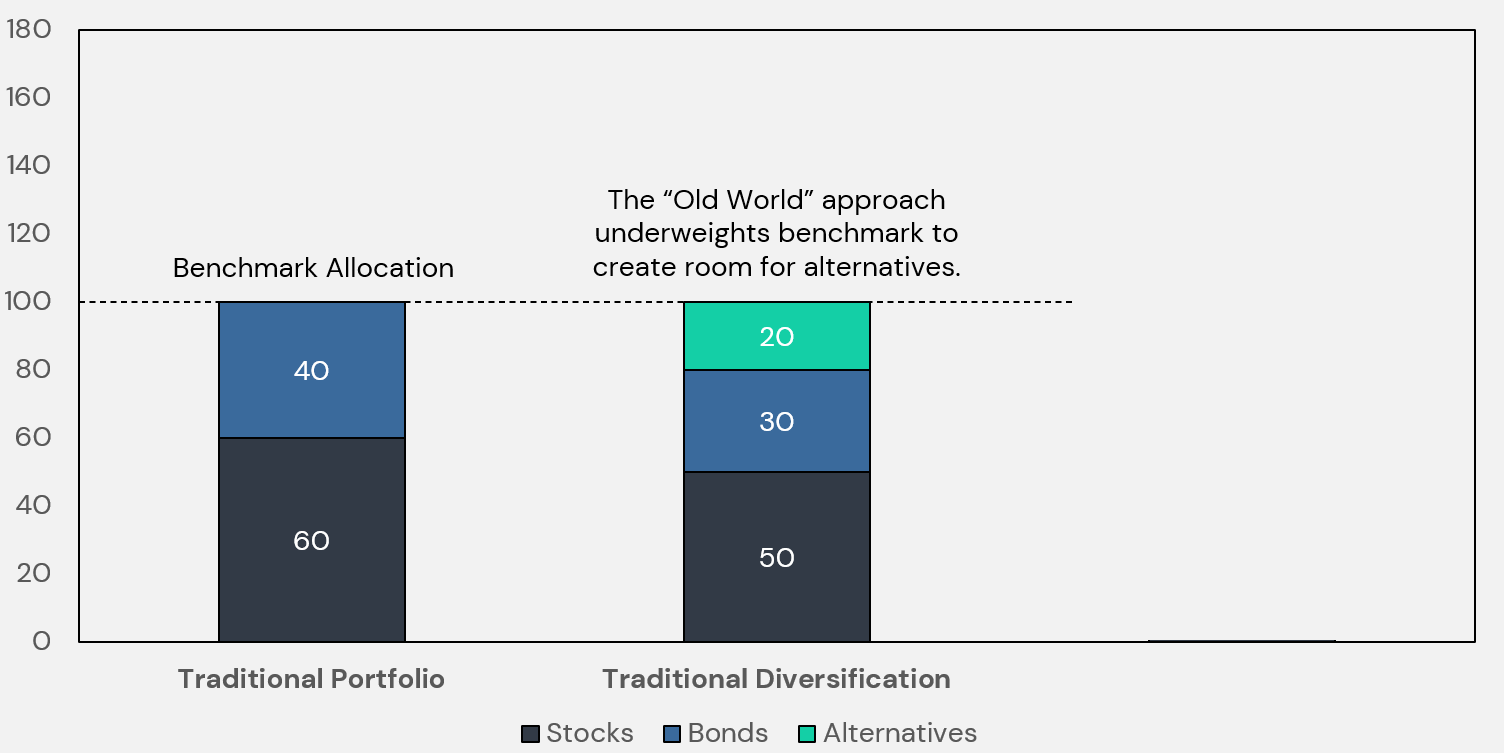
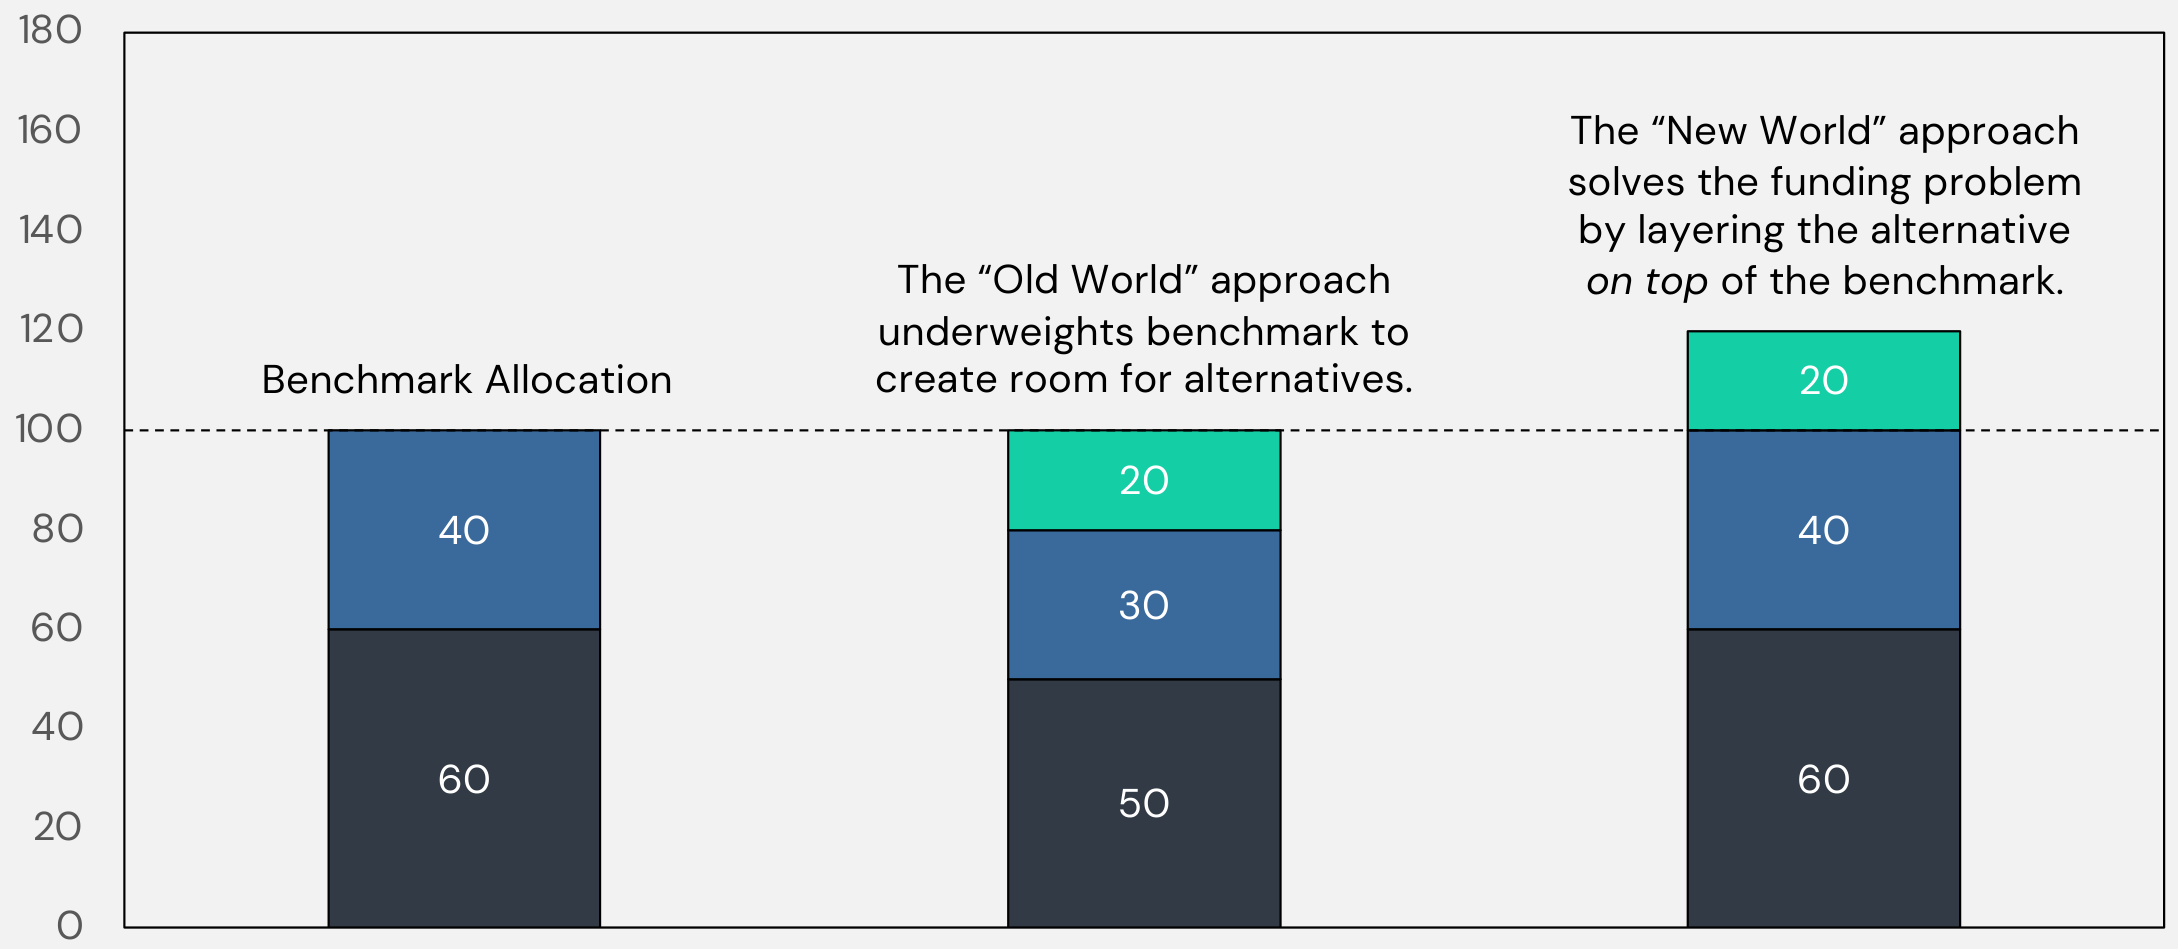
A common challenge in adding alternatives to a traditional 60/40 portfolio is the “funding problem.” Advisors often must sell down some of the existing equity or bond exposure to make room for new strategies. This can create behavioral friction and regret, especially if the timing is unfavorable and the original assets subsequently outperform.
Figure 9. The Alternative Strategy "Funding" Problem
For illustrative purposes only.
This conventional approach forces a trade-off mentality: “If I add alternatives, I must give up some of my equities or bonds,” leading to inevitable regret during certain market regimes.
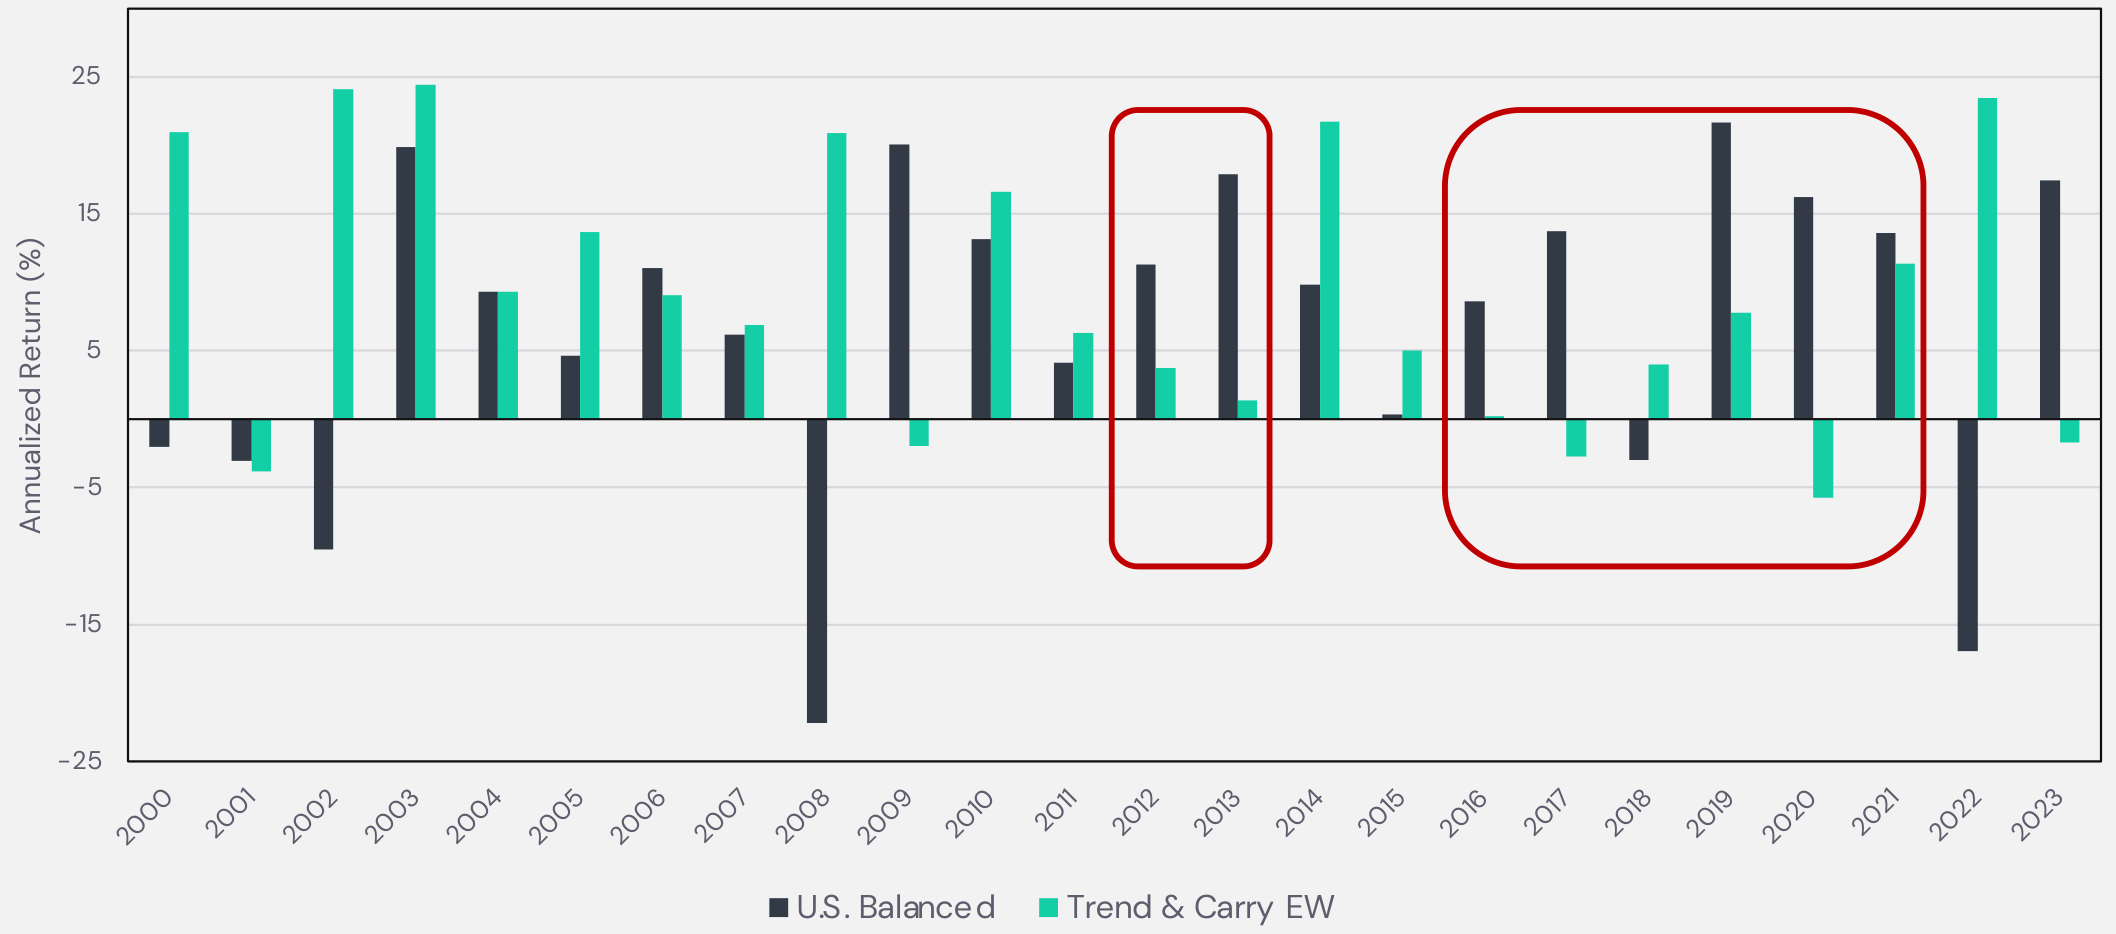
Figure 10. Annual Returns Comparison: U.S. Balanced vs. Trend & Carry EW
Source: ReSolve Asset Management Inc., Tiingo and Société Générale. Analysis by ReSolve Asset Management SEZC (Cayman). Trend is the Société Générale Trend Index (“NEIXCTAT”), an index designed to track the largest trend following commodity trading advisors (“CTAs”) in the managed futures space net of underlying fees. Carry is index data based on HYPOTHETICAL returns from Butler, A.D & Butler A. (2014), Managed Futures Carry: a Practitioners Guide. U.S. Balanced is the Vanguard Balanced Fund (VBINX). 100% U.S. Balanced & 25% Carry & 25% Trend is 60% S&P 500 Index (“SPX”), 40% Bloomberg U.S. Aggregate Bond Index (“LBUSTRUU”), 25% Trend, 25% Carry minus 50% Bloomberg Short Treasury U.S. Total Return Index (“LD12TRUUU”) rebalanced daily and is hypothetical performance.. You cannot invest in an index. Please see glossary at the end of this presentation for index definitions. Returns assume the reinvestment of all distributions and are gross of taxes. Period is 12/31/1999 through 12/31/2023. The starting date is chosen based upon the earliest date data is available for the underlying indexes. Please read full disclaimer on hypothetical performance at the end of this presentation. Past performance is not indicative of future results.
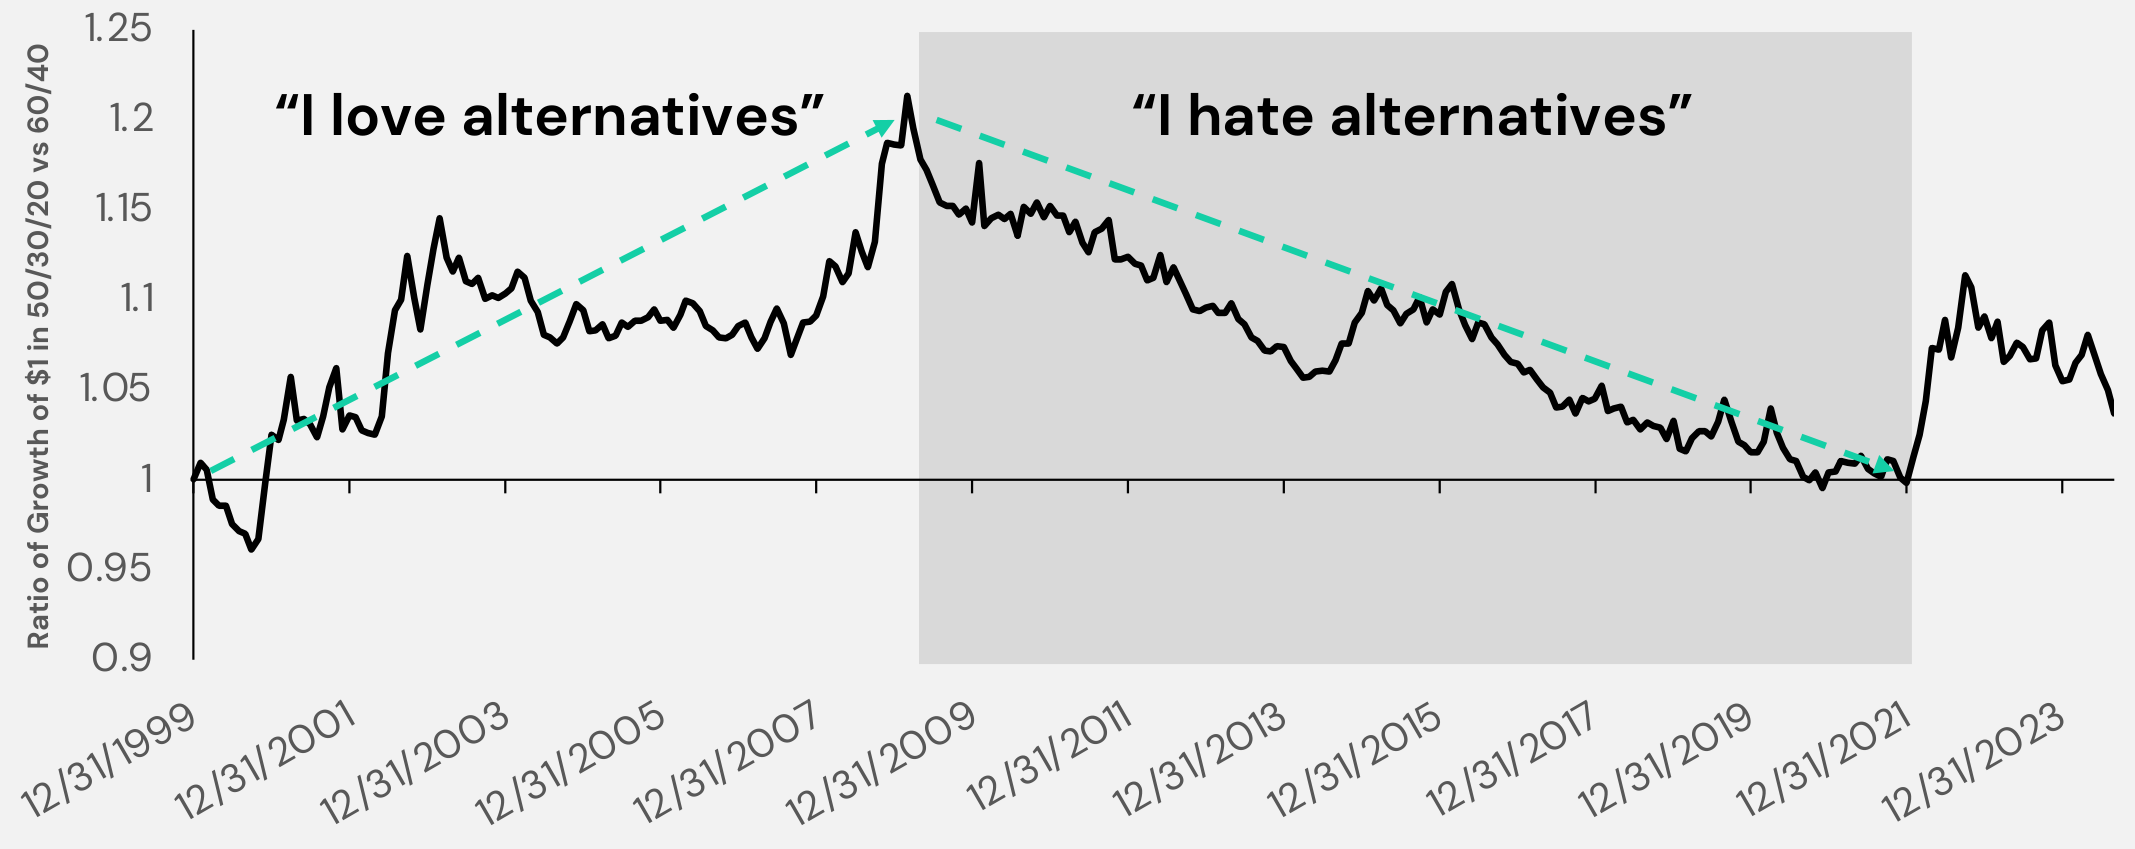
Figure 11. Relative Performance: 50/30/20 vs 60/40
Source: ReSolve Asset Management Inc., Tiingo, Société Générale. The chart illustrates cycles of investor sentiment towards alternatives.
The “Yes And” Approach: Return Stacking
Return stacking allows investors to maintain their core portfolio exposures (e.g., a 60/40 allocation) and then layer on complementary return streams like trend and carry. By using capital-efficient futures positions, advisors can add a second, diversifying source of returns without displacing existing allocations.
Figure 12. Portfolio Allocation Comparison
For illustrative purposes only.
Mechanics of Return Stacking
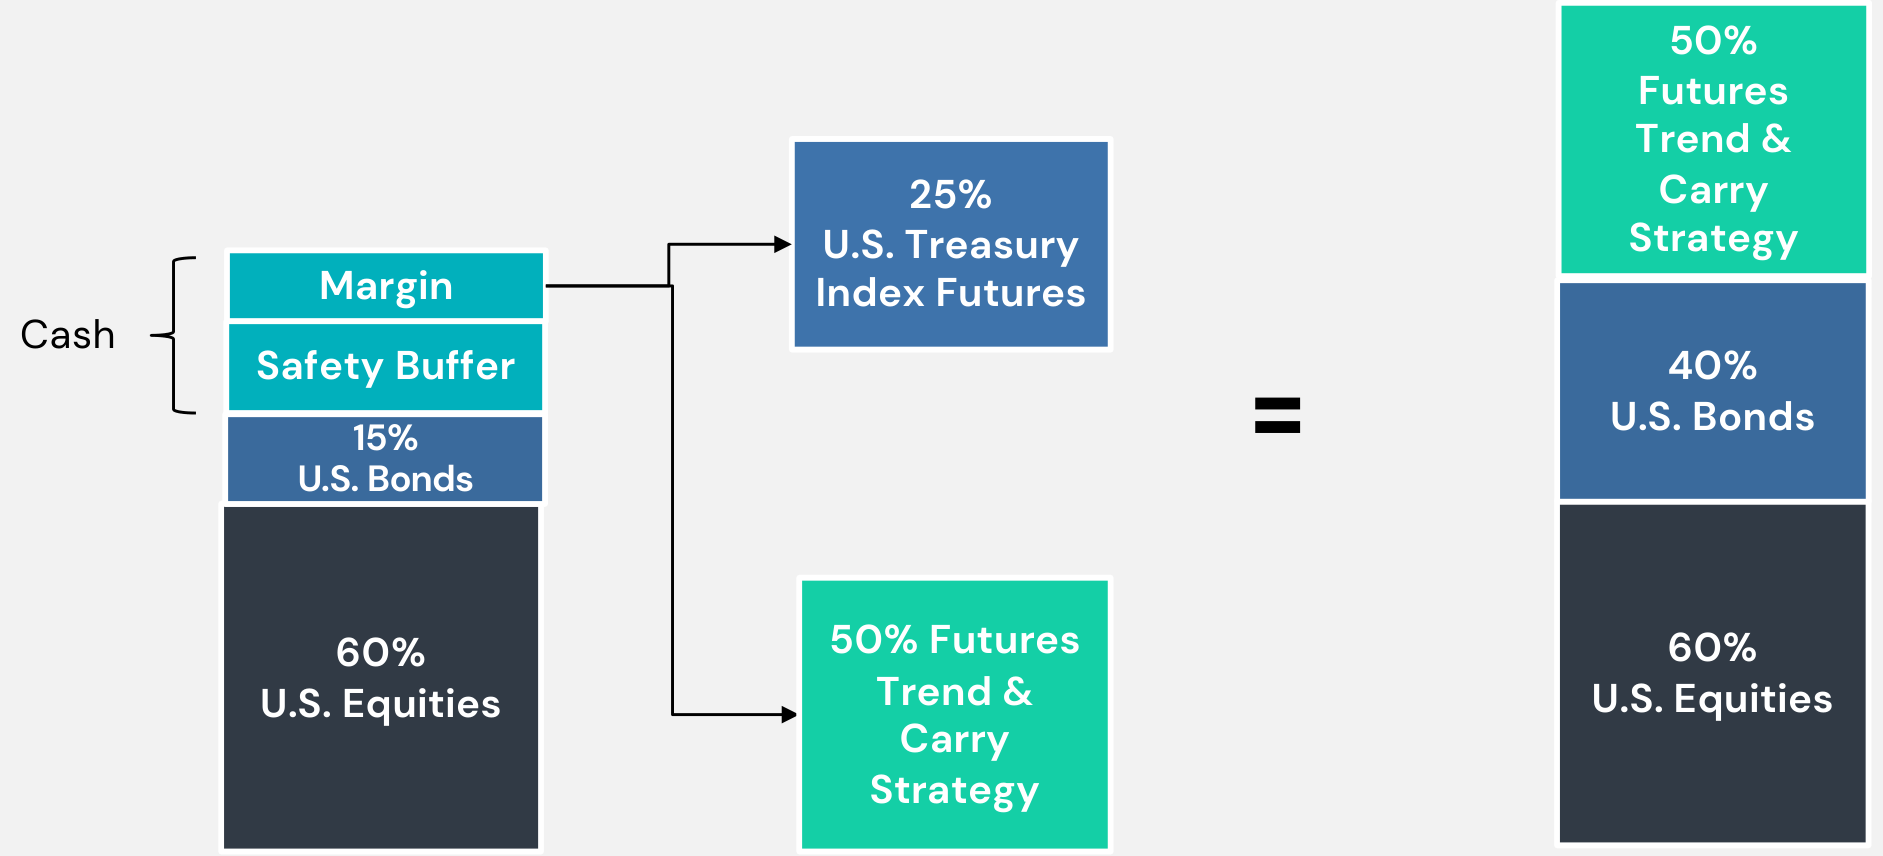
The technique often involves freeing up cash through treasury futures or other derivatives and using that freed cash as margin for the systematic macro strategies. A portion of the portfolio effectively does “double-duty,” maintaining exposure to traditional assets while adding a diversified source of return.
Figure 13. Stacking Carry & Trend Implementation
For illustrative purposes only. U.S. Equities are U.S. equity securities or ETFs. “Cash” may be money market funds or short-term U.S. Treasury Bills. U.S. Bonds are U.S. Aggregate Bonds and/or U.S. Treasury Index Futures. 50% Futures Trend & Carry Strategy represents an equal-weight hypothetical allocation.
Performance Analysis: Validating the Yes AND Solution
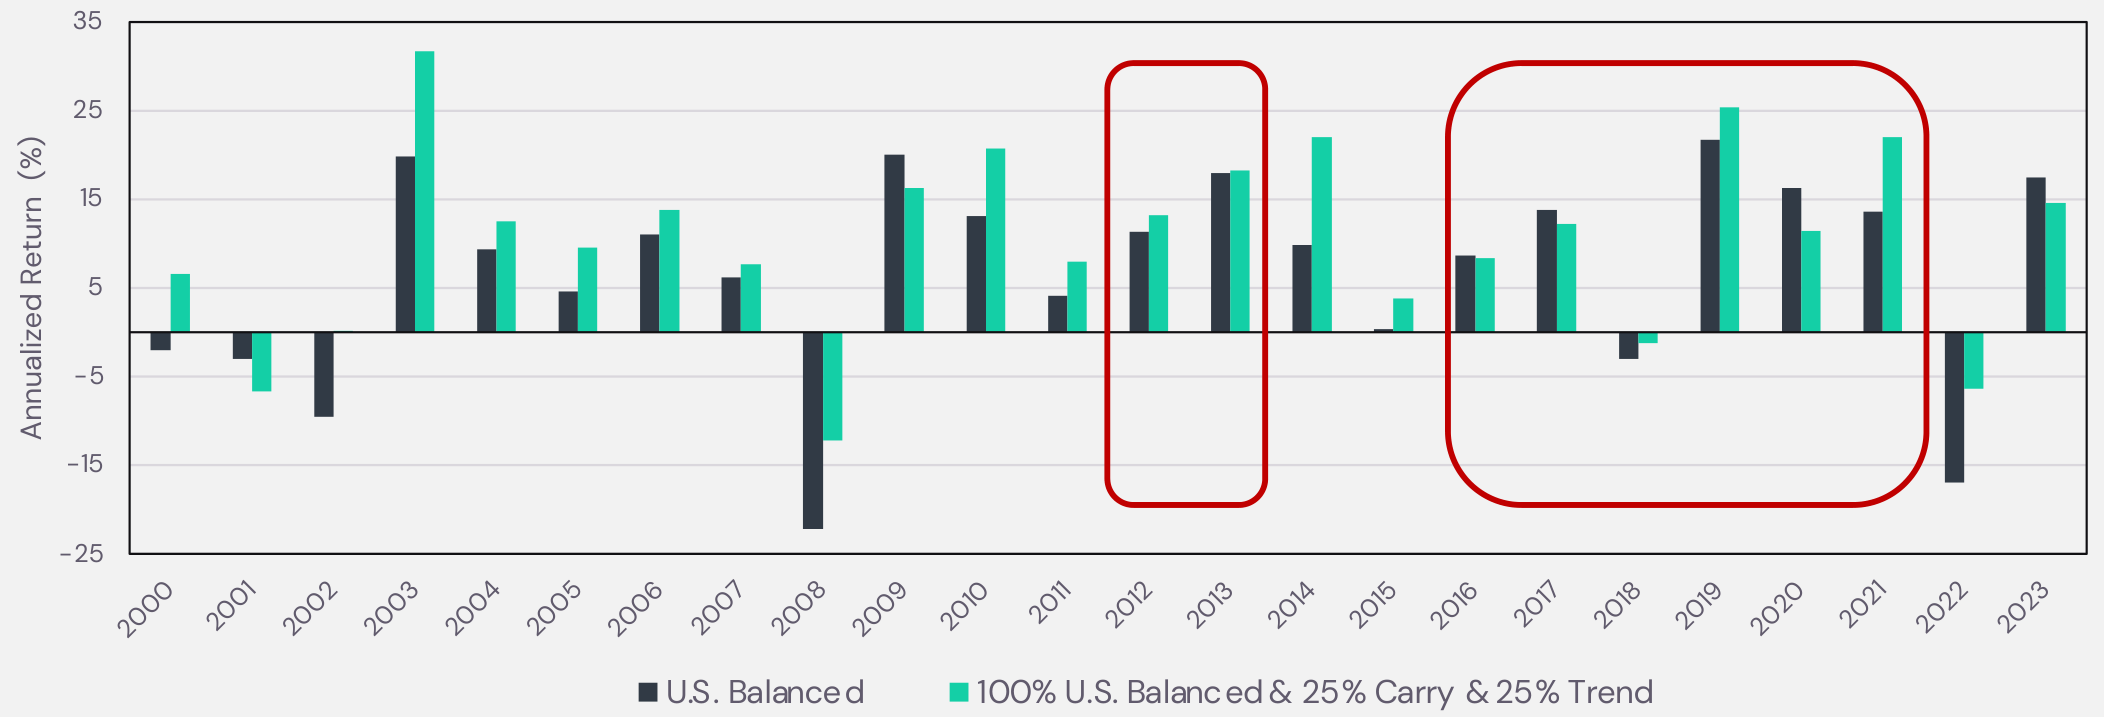
To ensure these theoretical benefits hold up in practice, we examine historical simulations of combining trend and carry strategies when introduced to a portfolio via a return stacking framework. Here the green bars represent the calendar returns of adding a 50% equal weight trend and carry stack on top of a U.S. Balanced portfolio.
Figure 14. Annual Returns Comparing a U.S. Balanced allocation without and with Return Stacking
Figure 15. Performance Metrics Comparison
Source for figure 14 and 15: ReSolve Asset Management Inc., Tiingo and Société Générale. Analysis by ReSolve Asset Management SEZC (Cayman). Trend is the Société Générale Trend Index (“NEIXCTAT”), an index designed to track the largest trend following commodity trading advisors (“CTAs”) in the managed futures space net of underlying fees. Carry is index data based on HYPOTHETICAL returns from Butler, A.D & Butler A. (2014), Managed Futures Carry: a Practitioners Guide. U.S. Balanced is the Vanguard Balanced Fund (VBINX). 100% U.S. Balanced & 25% Carry & 25% Trend is 60% S&P 500 Index (“SPX”), 40% Bloomberg U.S. Aggregate Bond Index (“LBUSTRUU”), 25% Trend, 25% Carry minus 50% Bloomberg Short Treasury U.S. Total Return Index (“LD12TRUUU”) rebalanced daily and is hypothetical performance.. You cannot invest in an index. Please see glossary at the end of this presentation for index definitions. Returns assume the reinvestment of all distributions and are gross of taxes. Period is 12/31/1999 through 12/31/2023. The starting date is chosen based upon the earliest date data is available for the underlying indexes. Please read full disclaimer on hypothetical performance at the end of this presentation. Past performance is not indicative of future results.
Risk and Drawdowns Expectations
When assessing the possible increase in the risks associated with return stacking there is often a belief that we may be stacking as much risk as we are returns. But what we empirically observe from Figure 15 is that while returns went up by 387 basis points, risk only went up by 129 basis points!
To understand how this is possible we need to understand the components of portfolio volatility. In simple terms:
Portfolio volatility = weighted average volatility of the strategies ÷ Diversification Ratio
Where
Diversification Ratio = Weighted Average Volatility of each strategy ÷ Realized Portfolio Volatility
In short, the higher the diversification ratio, the lower the portfolio volatility. And since both trend an carry have such low correlation to bonds, stocks and each other, stacked on top of a portfolio they offer the benefit of a very high diversification ratio which is ideal for stacking.
The takeaway here should be that in order to keep excessive risks at bay from stacking one should minimize stacking similar risks and favor stacking strategies that reliably offer low correlation to the core portfolio. This allows investors to stack return while not necessarily stacking the same amount of risk.
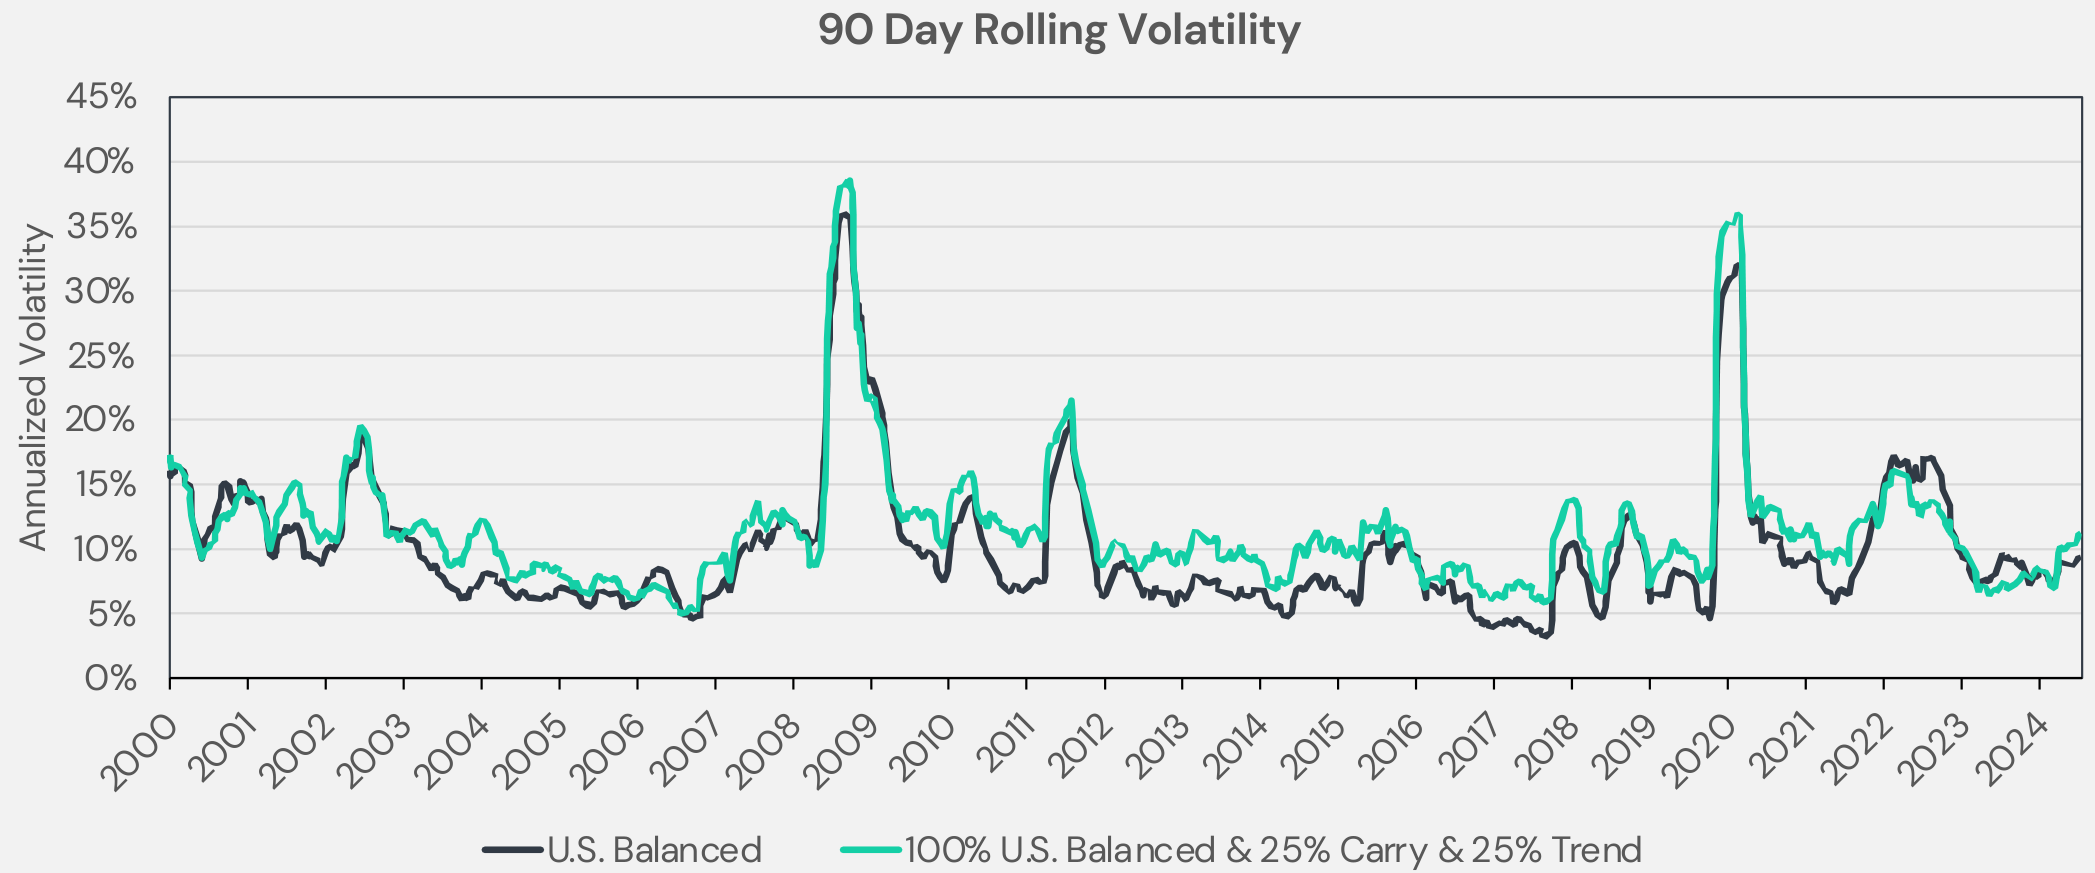
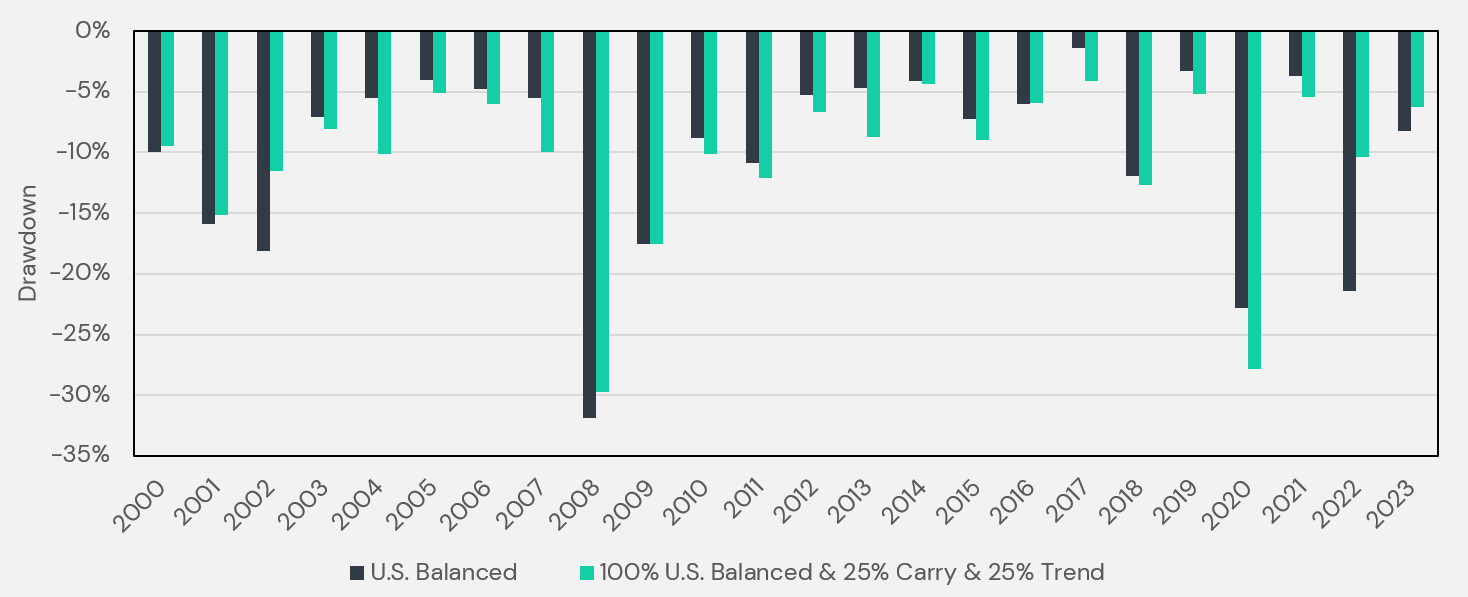
Regardless, stacking trend and carry does somewhat increase the amount of ambient risk to a portfolio. We can see in Figure 16 how the rolling 90 day volatility of the stacked portfolio hovers slightly above the non-stacked portfolio. Moreover, this will mean that there will be many calendar years where the maximum peak-to-trough losses of the stacked portfolio will also be higher.
Figure 16. 90-Day Rolling Volatility (50% Stack)
Source: ReSolve Asset Management Inc., Tiingo and Société Générale. Analysis by ReSolve Asset Management SEZC (Cayman). Trend is the Société Générale Trend Index (“NEIXCTAT”), an index designed to track the largest trend following commodity trading advisors (“CTAs”) in the managed futures space net of underlying fees. Carry is index data based on HYPOTHETICAL returns from Butler, A.D. & Butler, A. (2014), Managed Futures Carry: a Practitioners Guide. U.S. Balanced is the Vanguard Balanced Fund (VBINX). 100% U.S. Balanced & 25% Carry & 25% Trend is 60% S&P 500 Index (“SPX”), 40% Bloomberg U.S. Aggregate Bond Index (“LBUSTRUU”), 25% Trend, 25% Carry minus 50% Bloomberg Short Treasury U.S. Total Return Index (“LD12TRUUU”) rebalanced daily and is hypothetical performance. You cannot invest in an index. Please see glossary at the end of this presentation for index definitions. Returns assume the reinvestment of all distributions and are gross of taxes. Period is 12/31/1999 through 12/31/2023. The starting date is chosen based upon the earliest date data is available for the underlying indexes. Please read full disclaimer on hypothetical performance at the end of this presentation. Past performance is not indicative of future results.
However, as shown in the previous section and now in Figure 17, we find that during prolonged multi-month equity market corrections the trend and carry combination exhibited reliable protection during the largest market drawdowns in the 23 year time horizon. The only exception was during the Covid crisis which was abrupt enough that neither strategy was agile enough to reposition to a protective stance in time (yet still managed to keep major losses at bay).
Figure 17. Maximum Yearly Drawdowns (50% Stack)
In Summary
The combination of carry and trend following strategies presents a compelling case for advisors who seek to enhance portfolio resilience. Both strategies tap into distinct, persistent sources of return—behavioral inefficiencies for trend and economic risk premia for carry. By blending these approaches, investors can reduce reliance on any single return driver and improve performance stability across varying market environments.
Key Insights:
- Complementary Return Drivers: Trend and carry focus on different facets of the return equation, delivering genuine diversification.
- Adaptive Crisis Protection: Contrary to conventional narratives, both strategies can offer meaningful downside protection in equity and bond stress scenarios.
- Behavioral Advantages Through Return Stacking: By layering these strategies atop existing allocations, advisors avoid the “funding problem,” reducing behavioral frictions and the risk of regret.
As markets evolve, the systematic nature of these strategies—underpinned by robust theoretical and empirical foundations—suggests they can persistently add value. While careful consideration of implementation details is essential, modern tools and structures exist to streamline adoption.


