Don’t Skew It Up: Return Stacking for Smoother Returns
Overview
Managing portfolio risk during market downturns is a key concern for financial advisors. While diversification is a core principle of portfolio construction, its effectiveness can weaken when asset class correlations rise in times of stress.
Skewness, a statistical measure of a portfolio’s return asymmetry, offers a useful lens for evaluating downside risk. A negatively skewed portfolio has a higher probability of extreme losses, while a positively skewed portfolio may benefit from larger-than-expected positive returns.
Return stacking, also known as portable alpha, presents a structural approach to managing skewness. This strategy seeks to mitigate left-tail risk while preserving equity exposure. This article explores how implementing a 100% stocks + 100% managed futures approach may help improve portfolio skewness and reduce drawdowns during periods of market stress.
Key Topics
Portfolio Risk, Risk Management, Managed Futures, Portable Alpha, Return Stacking
How Financial Advisors Can Use Stacking to Proactively Manage Skewness
Return stacking allows advisors to maintain full equity exposure while incorporating a diversifying strategy, potentially improving portfolio resilience. By maintaining full equity exposure while layering in a diversifying return stream, advisors can seek to reduce negative skew in an equity-centric investment portfolio.
Why Consider Skewness Reduction Through Return Stacking?
Many diversification strategies require reducing core equity allocations to make room for diversifying assets. This trade-off can lead to lower long-term return potential. Return stacking addresses this challenge by maintaining full equity exposure while incorporating managed futures, which have historically delivered uncorrelated returns and strong performance in market downturns.
A return-stacked portfolio may offer:
- A more favorable skew profile – Seeking to reduce left-tail risk while maintaining upside potential. Historically, managed futures has performed well during equity downturns, which can reduce the impact of a bear market at the portfolio level.
- Diversification without sacrificing core exposure – Retaining full equity exposure while adding managed futures as an overlay. This enables investors to stick to the investment plan and maintain diversification in their portfolio.
- Potential improvement in risk-adjusted returns – Providing an alternative return stream that has historically provided an attractive return profile, potentially increasing total portfolio returns and reducing portfolio volatility.
Understanding Portfolio Skewness
Skewness measures the asymmetry of a return distribution. A negatively skewed portfolio experiences frequent small gains but occasional large losses, whereas a positively skewed portfolio has more frequent small losses but occasional large gains. For context, a portfolio that has a perfectly normal return distribution would hold a skewness of exactly zero.
- Negative skew: More frequent small gains but occasional large losses.
- Positive skew: More frequent small losses but occasional large gains.
Equity portfolios tend to exhibit negative skew, meaning they are susceptible to large drawdowns during economic headwinds. Managed futures strategies have historically exhibited positive skew, as they aim to capitalize on persistent market trends—whether in rising or falling markets.
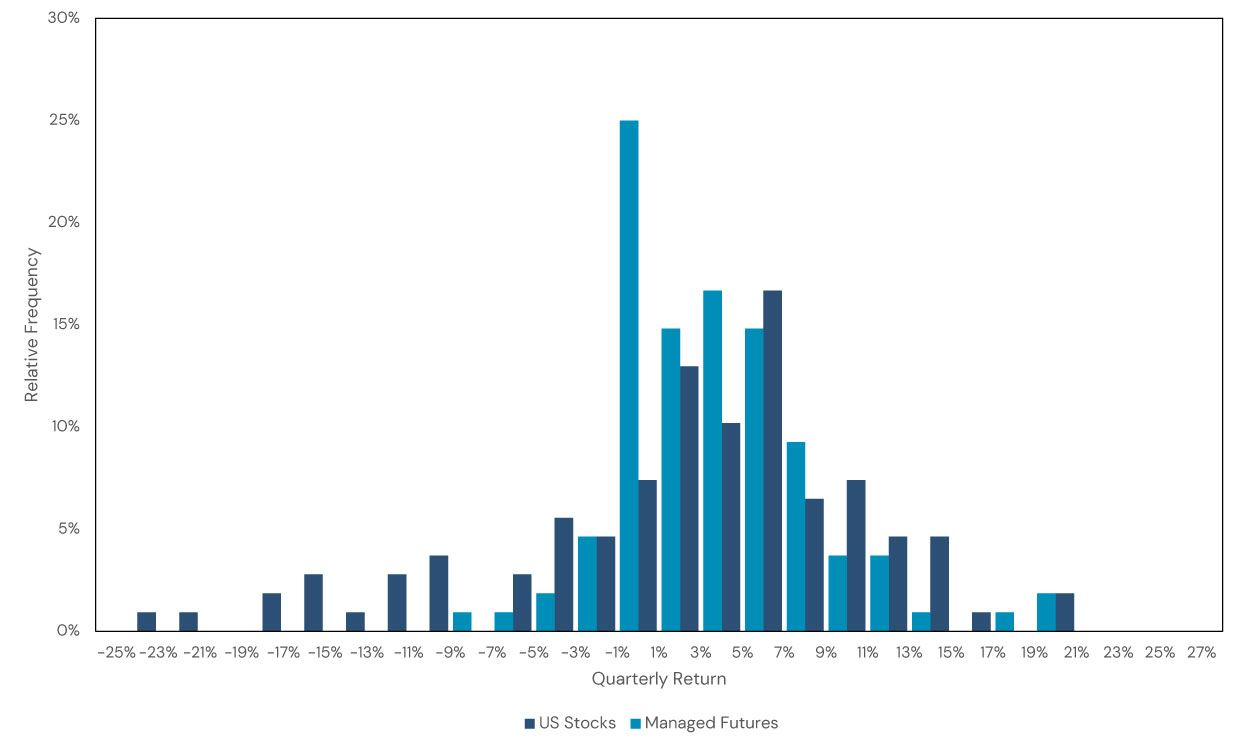
In Figure 1, we show the empirical quarterly return relative frequency distribution of global equities and managed futures. For equities, we see that a sizable portion of the observations fall to the left side of the distribution, with 10% of the total observations below -12% (skewness of -0.85). For managed futures, on the other hand, we see that the observations are clustered around zero but also are skewed to the right side of the distribution (skewness of +0.94), indicating that the strategy has exhibited infrequent, but large, returns in a given quarter, alongside more frequent returns around 0%.
Register for our Advisor Center
Tools Center:
Easily backtest & explore different return stacking concepts
Model Portfolios:
Return stacked allocations, commentary and guidance designed
for a range of client risk profiles and goals
Future Thinking:
Receive up-to-date insights into the world of return stacking theory and practice
Figure 1: Historical Quarterly Return Distribution for Equities and Managed Futures
Source: Bloomberg and Pivotal Path. Calculations by Newfound Research. Global Equities is the MSCI USA Total Return Index USD (M2US). Managed Futures is the Pivotal Path Managed Futures Index (MFT). Performance is gross of all fees, taxes and transaction costs. Performance assumes the reinvestment of all distributions. Performance of MFT is net of underlying management and performance fees. Data is for illustrative purposes only. Data is from December 1997 to December 2024 due to data availability.
Adding managed futures as an overlay to an equity portfolio may improve skewness due to their historically low correlation with stocks and their ability to generate returns in both rising and falling markets. Historically, managed futures have tended to perform well during equity drawdowns, as they capitalize on persistent market trends across asset classes. This dynamic can help offset left-tail risk in an equity-centric portfolio.
For example, during the 2008 Global Financial Crisis, global equities experienced a maximum drawdown of approximately -51% from October 2007 to February 2009, while managed futures strategies returned +31% in the same period.
Similarly, in 2022, as equities and bonds fell sharply amid inflation-driven uncertainty, managed futures provided a positive return, once again demonstrating their role in mitigating extreme losses in traditional portfolios and providing a potential defense against unanticipated inflation.
By integrating managed futures as an overlay, advisors can potentially shift the portfolio’s overall return distribution toward a more positive skew, reducing exposure to extreme downside events in traditional markets while maintaining participation in equity market growth.
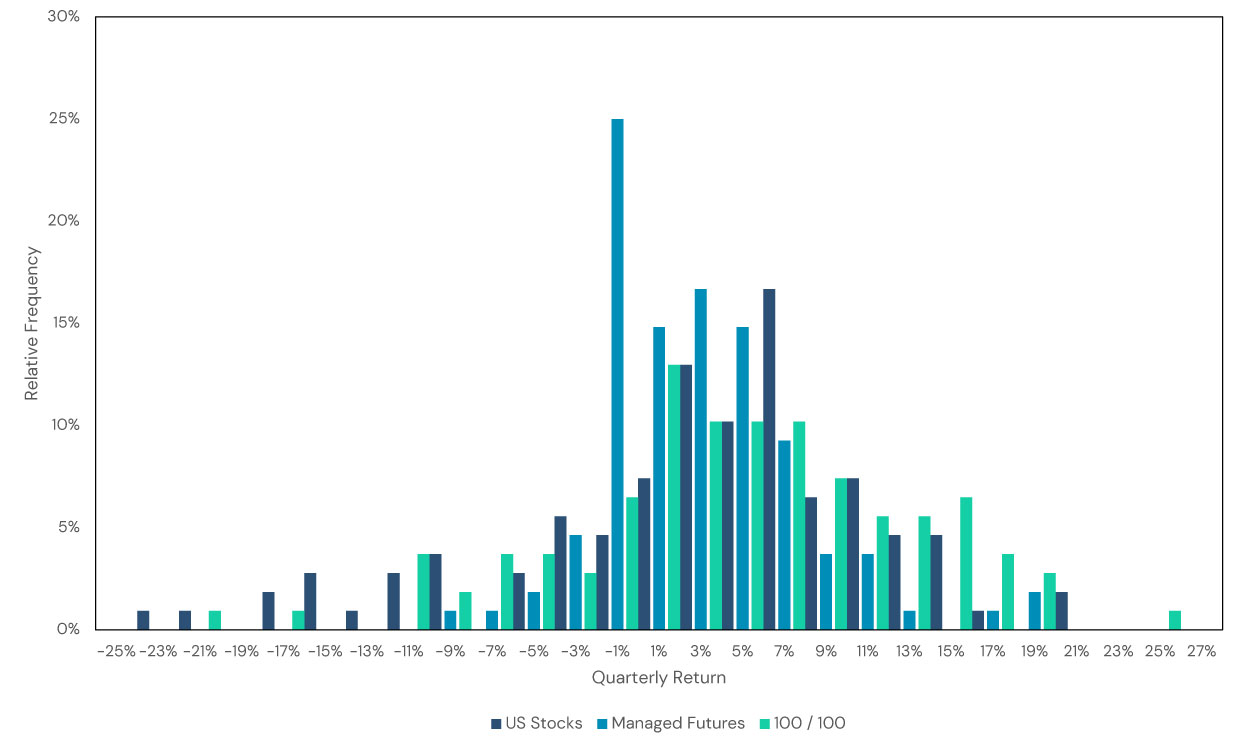
Figure 2 shows the empirical quarterly distribution of a hypothetical 100/100 equities + managed futures strategy alongside both investments.
Figure 2: Historical Quarterly Return Distribution for a 100/00 Portfolio
Source: Bloomberg. Managed Futures is the PivotalPath Managed Futures Index (”MFT”). 100/100 is 100% MSCI USA Total Return Index (”M2US”) / 100% MFT / -100% Bloomberg Short-Term US Treasury Bill Index (”LD12TRUU”) rebalanced monthly. Past performance is not indicative of future results. Performance is gross of all fees, taxes, and transaction costs. Performance assumes the reinvestment of all distributions. Performance of Managed Futures is net of underlying management and performance fees. Investors cannot invest directly in an index. Performance data is for illustrative purposes only and does not represent actual returns of a specific fund or investment product.
By stacking managed futures on top of equities, instead of stacking risk, the stacked exposure added diversification, reducing the severity of the worst quarterly returns in equities, while also shifting the distribution of returns farther to the right. This 100% stocks + 100% managed futures portfolio improved the skewness of the portfolio to -0.35, a marked increased from a solely equity-based portfolio (-0.85).
Negative outcomes are typically the focus when evaluating a diversifier. However, since the skewness of the 100/100 portfolio has increased, Figure 2 highlights another important aspect. The frequency of positive outcomes has also increased. Additionally, the portfolio helps mitigate larger drawdowns, which can be particularly attractive when constructing a portfolio for longer time frames.
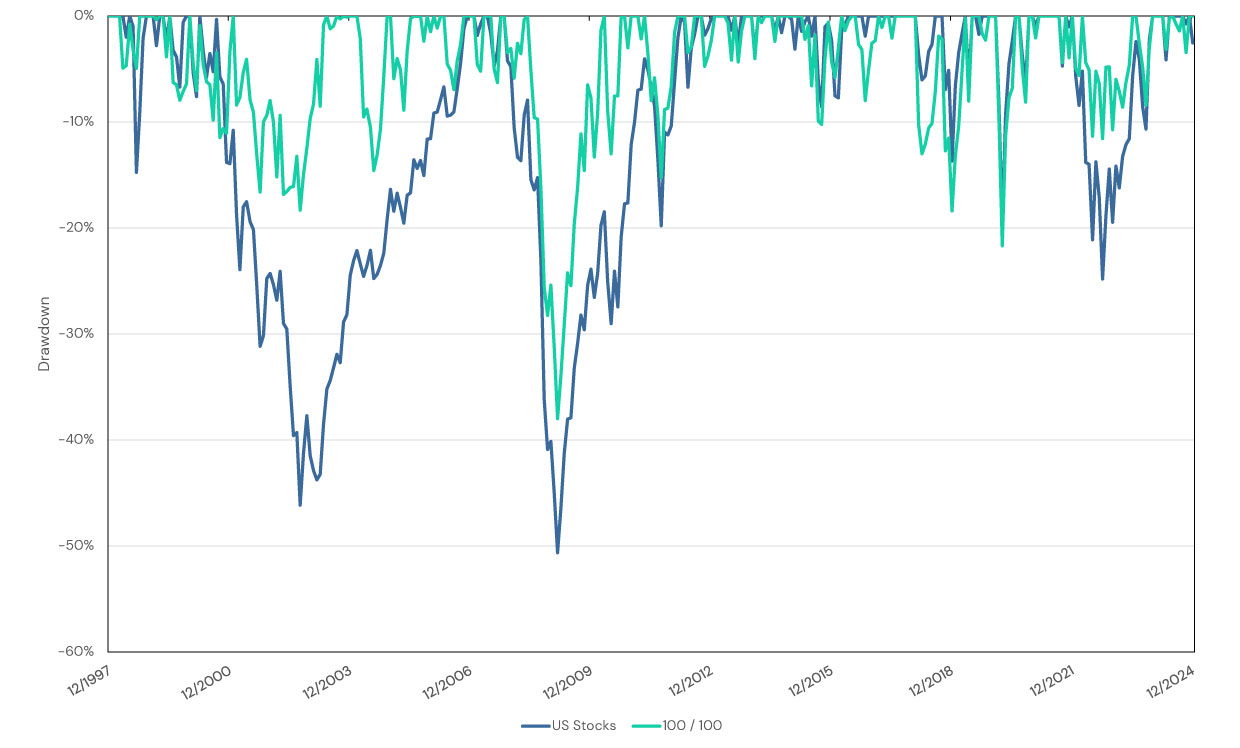
In Figure 3 and 4, we show the historical drawdown profile of the 100/100 relative to an all-equity portfolio, as well as the risk and return metrics of the three portfolios.
Figure 3: Drawdown Profile of US Stocks and a 100/100 Portfolio
Source: Bloomberg. Managed Futures is the PivotalPath Managed Futures Index (”MFT”). 100/100 is 100% MSCI USA Total Return Index (”M2US”) / 100% MFT / -100% Bloomberg Short-Term US Treasury Bill Index (”LD12TRUU”) rebalanced monthly. Past performance is not indicative of future results. Performance is gross of all fees, taxes, and transaction costs. Performance assumes the reinvestment of all distributions. Performance of Managed Futures is net of underlying management and performance fees. Investors cannot invest directly in an index. Performance data is for illustrative purposes only and does not represent actual returns of a specific fund or investment product.
Figure 4: Risk and Return Metrics
Source: Bloomberg. Managed Futures is the PivotalPath Managed Futures Index (”MFT”). 100/100 is 100% MSCI USA Total Return Index (”M2US”) / 100% MFT / -100% Bloomberg Short-Term US Treasury Bill Index (”LD12TRUU”) rebalanced monthly. Past performance is not indicative of future results. Performance is gross of all fees, taxes, and transaction costs. Performance assumes the reinvestment of all distributions. Performance of Managed Futures is net of underlying management and performance fees. Investors cannot invest directly in an index. Performance data is for illustrative purposes only and does not represent actual returns of a specific fund or investment product.
Final Thoughts
For financial advisors seeking to enhance client portfolios by reducing downside risk while maintaining full equity exposure, return stacking with managed futures presents a compelling option. By combining 100% stocks + 100% managed futures, advisors may build more resilient portfolios that better withstand market stress while preserving long-term return potential.
For financial professionals interested in exploring how return stacking may impact an investment portfolio, Return Stacked Solutions has developed various tools to explore diversification and risk in portfolios. Connect with one of our Advisor Solution Representatives to learn more.
Key Takeaways for Financial Advisors
- Managing portfolio skewness is crucial – Negative skew increases exposure to large, infrequent losses.
- Return stacking offers a potential solution – Seeking to reduce skewness without sacrificing equity exposure.
- Historical data suggests benefits – A 100% stocks + 100% managed futures portfolio has historically exhibited improved risk-adjusted returns and reduced drawdowns relative to an all-equity portfolio.
- Managed futures provide an uncorrelated return stream – A key tool in mitigating left-tail risk and potentially improving portfolio returns.
Disclaimers:
The PivotalPath index/indices used in this information is/are produced by the hedge fund research and investment consultancy firm, PivotalPath Inc. The information is representative of the overall composition of the hedge fund universe, as well as specific sub-strategies, including but not limited to the PivotalPath Hedge Fund Composite Index; the PivotalPath Credit Index (and associated sub-indices); the PivotalPath Equity Diversified Index (and associated subindices); the PivotalPath Equity Sector Index (and associated sub-indices); the PivotalPath Event Driven Index (and associated sub-indices); the PivotalPath Global Macro Index (and associated sub-indices); the PivotalPath Managed Futures Index; the PivotalPath Multi-Strategy Index; PivotalPath Equity Quant Index; and the PivotalPath Volatility Index.
PivotalPath Indices are the proprietary product of PivotalPath Inc. They represent Hedge Fund Indices based on collected data from individual hedge funds and while PivotalPath considers the sources of such information and data to be reliable, such information and data has been verified but has not been audited by PivotalPath. No representation is made as to, and no responsibility or liability is accepted for, the accuracy or completeness of such information and data. PivotalPath Index constituents may be removed at any time and any PivotalPath index may be restated, adjusted, or corrected at any time without notice.
PivotalPath data is being used under license from PivotalPath, Inc, which does not approve of or endorse any of the products or the contents discussed in these materials.


