More Than Enough is Too Much
Overview
In the realm of portfolio theory, the integration of Return Stacking emerges as a nuanced approach to bolstering diversification while maintaining a balanced exposure to stocks and bonds. This piece delves into the strategic utilization of Tactical Asset Allocation (TAA), a method poised to dynamically refine portfolio allocations in tune with market dynamics, presenting a sophisticated alternative to traditional stock/bond portfolio leveraging strategies. The exploration underscores the nuanced construction required for portfolios to not just meet but potentially exceed benchmarks, even when faced with market uncertainties.
Key Topics
Diversification, Information Ratio, Leverage
The Challenge of Beating Benchmarks
As a concept, we believe that Return Stacking is enormously beneficial to investors. As we prescribe it, this idea allows them to maintain their current stock and bond exposures, while also introducing diversifying exposures into their portfolios.
One tempting idea, though, may be to stack more stock or bond exposure into a portfolio. But is that the best course of action?
In this post, we will explore the implications of stacking extra stocks and bonds on top of a portfolio, while offering a potential solution through the introduction of tactical asset allocation strategies.
Why Not 100% Equities?
To find a common starting point, we first will lean on Cliff Asness from AQR, who wrote a seminal paper in 1996 entitled “Why Not 100% Equities”. In this paper, Asness outlines the reasoning behind why a 100% equity portfolio would be suboptimal when compared to a stock/bond portfolio, levered to the equivalent volatility of equities.
To briefly paraphrase the analysis of the paper, as well as its findings, Modern Portfolio Theory argues that an investor should choose a mix of assets that maximizes the portfolio’s Sharpe Ratio, then lever that portfolio to the target volatility level. If an investor begins with a 60/40 portfolio as the optimal Sharpe portfolio, she will need to lever this portfolio approximately 1.55 times to achieve a similar volatility. As the paper’s results show, this levered portfolio outperforms 100% equities, while realizing an improved Sharpe ratio.
With the introduction of capital efficient funds that allow us to attain levered exposure to various asset classes, the question then becomes: “How should we introduce leverage into our portfolio?”
One tempting conclusion would be to simply increase our current exposures, but could that potentially lead to too much exposure in one or more asset classes?
Conversely, we assert that an investor should look to the variety of options available and thoughtfully lever stocks and bonds, in the context of those asset classes and strategies.
Having laid the foundation behind not adopting a 100% equities approach and recognizing the potential benefits of thoughtful leverage in stock and bond portfolios, we now turn our attention to the realm of Tactical Asset Allocation (TAA).
What is Tactical Asset Allocation? (A Brief Explanation)
By and large, TAA strategies attempt to position the strategy into assets that are expected to perform well in the future. In most instances, strategies such as these rely on signals such as trend or relative momentum to decide on portfolio asset allocations, though, there exist many ways to tackle this problem. A TAA strategy may implement price-based, valuation-based, economic-based, volatility-based, and sentiment-based signals to position their portfolios, though, the specific implementation will depend largely on the manager of the strategy.
A simple example of such a strategy may be to invest in stocks when the current price of the S&P 500® Index is above its ten-month moving average. If it is below, go to cash or bonds.
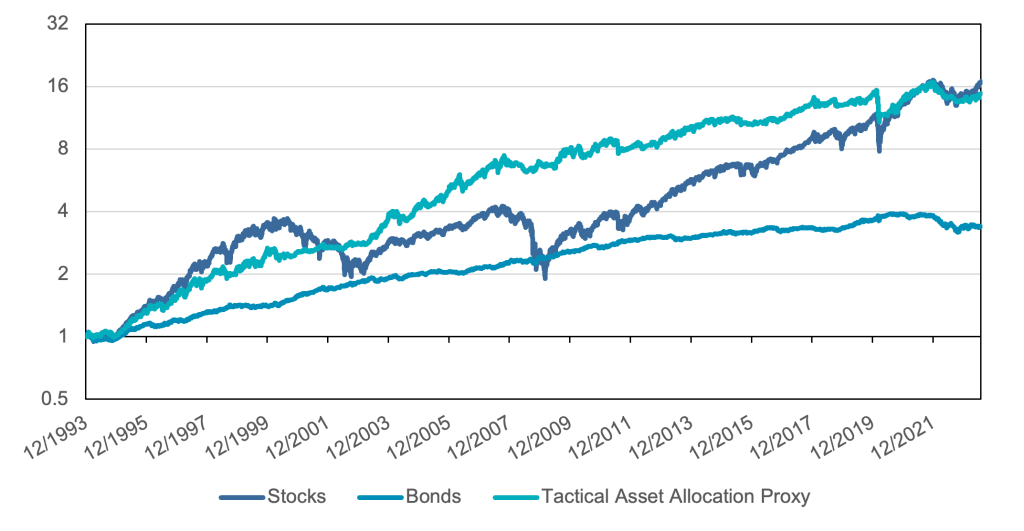
In this post, we will use a Tactical Asset Allocation Proxy (“TAA-P”) to illustrate a generic TAA strategy.
Figure 1 shows the historical performance of stocks, bonds, and the tactical asset allocation strategy since 1993.
Figure 1: Stocks, Bonds, and Tactical Asset Allocation Performance
Source: Tiingo, Solactive. Calculations by Newfound Research. The starting date was chosen due to data availability. Stocks is the Vanguard 500 Index Fund Investors Shares (Ticker: VFINX), Bonds is the Vanguard Total Bond Market Index Fund Investor Shares (Ticker: VBMFX). Tactical Asset Allocation Proxy is the Newfound/ReSolve Robust Equity Momentum Index, net of a 1.00% annual fee. You cannot invest directly in an index.
While the efficient frontier is a powerful tool for illustrating the impact of asset allocation, what often escapes the visual representation is the real-world experience for an investor navigating these portfolios.
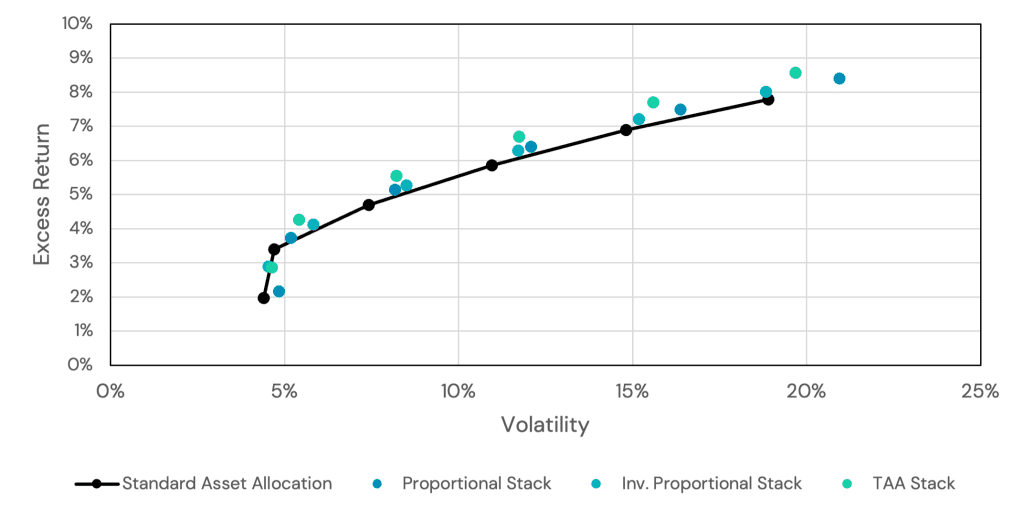
Let’s delve into the intuitive aspects of the efficient frontier. In the context of the Stock and Bond series, adjusting the allocation to equities typically leads to an increase in both expected return and volatility.
However, the introduction of diversifiers introduces a fascinating dynamic, allowing us to shift the frontier up-and-to-the-left. This opens the door to achieving a higher expected return while maintaining an equivalent or even lower level of risk.
Yet, beyond the lines and data points, what remains unexplored is the tangible experience for investors choosing among the myriad of possible diverse portfolios.
Register for our Advisor Center
Tools Center:
Easily backtest & explore different return stacking concepts
Model Portfolios:
Return stacked allocations, commentary and guidance designed
for a range of client risk profiles and goals
Future Thinking:
Receive up-to-date insights into the world of return stacking theory and practice
Should We Stack Stocks and Bonds?
Before running any sort of analysis, we can brainstorm a few ways we could add stocks and bonds onto an existing portfolio, as well as what that would mean for the risk and return characteristics of the portfolio.
First, we could add stocks and bonds proportionately to our existing portfolio. For example, if we currently hold a 60/40 portfolio, we could essentially lever up our current portfolio up to our desired allocation. If we wanted to target a notional allocation of 110%, we could add 6% stocks and 4% bonds (or multiply the allocations by 1.10), resulting in a 66/44 portfolio. Using this method, we can expect that the portfolio volatility will increase by approximately 10%, while the portfolio’s return will increase by approximately 10% of the excess return of the initial 60/40 portfolio. We would also expect the portfolio’s maximum drawdown to increase by roughly 10%, while the Sharpe ratio will remain the about the same.
Second, we could add stocks and bonds through their inverse proportions. Using the 60/40 example from above, if we wanted to again increase our notional exposure by 10%, we could add 4% stocks (0.1 x 40% bonds) and 6% bonds (0.1 x 60% stocks), leaving us with a 64/46 portfolio. Frankly, the same logic we applied in the last method is not as straightforward in this case, as the results will depend largely on the correlations between the existing exposure and the stacked exposure1. To not get too deep into the weeds, we will keep this section high-level. What we know for sure is that the portfolio’s return will increase by the excess return of the stacked stock and bond exposure. The resulting impact on volatility, drawdown, and Sharpe ratios will largely depend on the difference between the starting and ending internal diversification of the portfolio.
Finally, we could forego making any explicit decisions and utilize the additional 10% to add to a TAA-P strategy, leading to the portfolio adding either stocks or bonds dynamically over time.
To analyze the impact of each of these decisions, we will create each of these stacked portfolios and assess the resulting risk and return characteristics2.
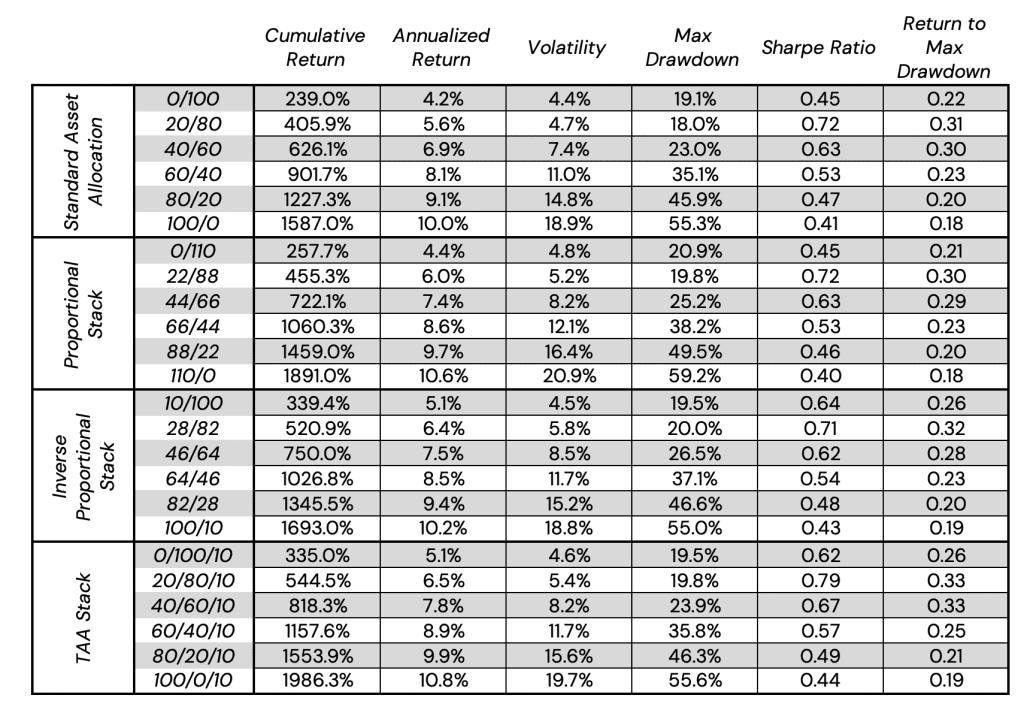
In Figure 2, we show the relationship of the return and volatility of standard strategic portfolios from 0/100 to 100/0 allocations, as well as the proportional stacked, inverse proportional stacked, and TAA-P stacked portfolios (stacking 10% of a tactical asset allocation strategy), targeting a 110% notional exposure in all cases. Figure 3 shows the total return and risk calculations.
Figure 2: Risk-to-Return Relationship
Source: Tiingo, Solactive, Kenneth French Data Library. Calculations by Newfound Research. Sharpe Ratios are calculated in excess of the Rf rate as obtained from the Kenneth French Data Library. The starting date was chosen due to data availability. Stocks is the Vanguard 500 Index Fund Investors Shares (Ticker: VFINX), Bonds is the Vanguard Total Bond Market Index Fund Investor Shares (Ticker: VBMFX). Tactical Asset Allocation Proxy is the Newfound/ReSolve Robust Equity Momentum Index, net of a 1.00% annual fee. You cannot invest directly in an index.
Figure 3: Risk and Return Calculations
Source: Tiingo, Solactive, Kenneth French Data Library. Calculations by Newfound Research. Sharpe Ratios are calculated in excess of the Rf rate as obtained from the Kenneth French Data Library. The starting date was chosen due to data availability. Stocks is the Vanguard 500 Index Fund Investors Shares (Ticker: VFINX), Bonds is the Vanguard Total Bond Market Index Fund Investor Shares (Ticker: VBMFX). Tactical Asset Allocation Proxy is the Newfound/ReSolve Robust Equity Momentum Index, net of a 1.00% annual fee. You cannot invest directly in an index.
By carefully reviewing the above figures, we find that our predictions were largely correct. Specifically looking at the 60/40 portfolio and its relevant stacks, we find the proportional stacked portfolio increased its returns by the excess return of the stack, the volatility increased by roughly 10%, the Sharpe ratio remained the same as the un-stacked version, and the drawdown increased by 10% as well.
For the inverse proportional stacked portfolio, we find that the returns increased by the excess return, the volatility increased (albeit by less than 10%), the Sharpe ratio marginally increased, and the drawdown increased (though less than 10%).
For the TAA Stacked portfolios, however, we find a somewhat different story. As expected, the return of the portfolio increased by the excess return of the TAA strategy, and the volatility increased as well. This led to a Sharpe ratio that meaningfully increased, while the drawdown remained approximately the same.
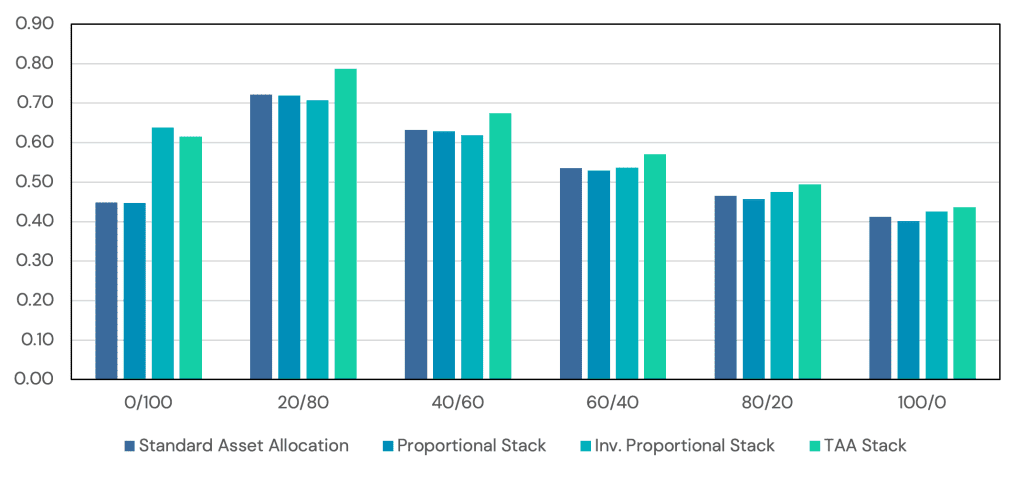
Figure 4 shows the Sharpe ratios of each of these portfolio (bucketed by starting asset allocation) and Figure 5 shows the maximum drawdowns.
Source: Tiingo, Solactive, Kenneth French Data Library. Calculations by Newfound Research. Sharpe Ratios are calculated in excess of the Rf rate as obtained from the Kenneth French Data Library. The starting date was chosen due to data availability. Stocks is the Vanguard 500 Index Fund Investors Shares (Ticker: VFINX), Bonds is the Vanguard Total Bond Market Index Fund Investor Shares (Ticker: VBMFX). Tactical Asset Allocation Proxy is the Newfound/ReSolve Robust Equity Momentum Index, net of a 1.00% annual fee. You cannot invest directly in an index.
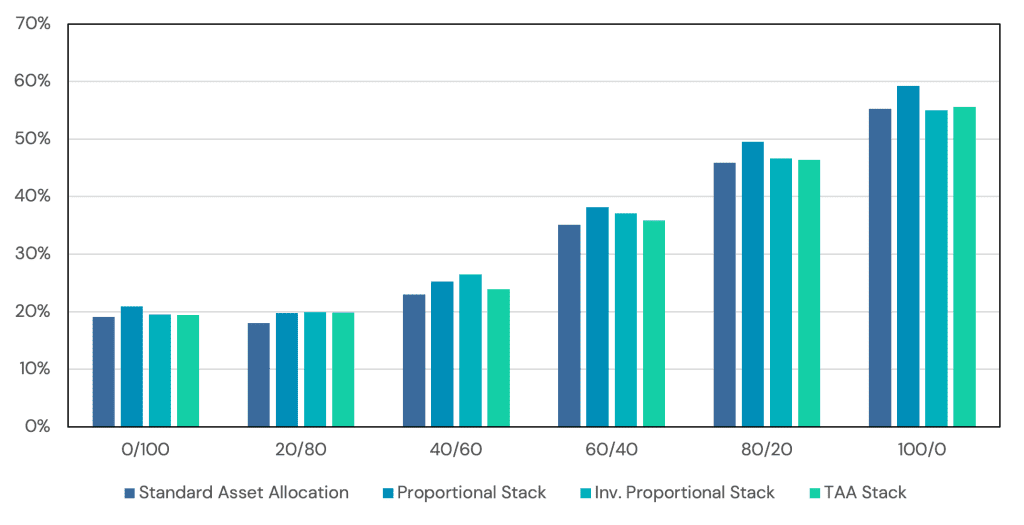
Source: Tiingo, Solactive, Kenneth French Data Library. Calculations by Newfound Research. Sharpe Ratios are calculated in excess of the Rf rate as obtained from the Kenneth French Data Library. The starting date was chosen due to data availability. Stocks is the Vanguard 500 Index Fund Investors Shares (Ticker: VFINX), Bonds is the Vanguard Total Bond Market Index Fund Investor Shares (Ticker: VBMFX). Tactical Asset Allocation Proxy is the Newfound/ReSolve Robust Equity Momentum Index, net of a 1.00% annual fee. You cannot invest directly in an index.
Across all of the strategic allocations, we can notice two distinct points. In all cases, the Sharpe ratio of the TAA Stacked portfolios increased, indicating that including the TAA strategy added diversification benefits or risk-mitigating characteristics to the portfolio.
Regarding the resulting max drawdown of the portfolio, the TAA Stacked portfolio held a maximum drawdown that was roughly similar to that of the starting portfolio. From this we can reason that despite the stacking of exposures, the inherent loss-risk of the stacked portfolio wasn’t dramatically impacted. Conversely, for the proportional and inverse proportional stacked portfolios, the drawdowns did increase.
If we again dig into the 60/40 versions, we can see that in both cases, the proportional stack and the inverse proportional stack increased the accumulated wealth of the investor. However, the end result suggests that the tactical asset allocation indeed provided an additional benefit. Figure 4 depicts the equity curves of the 60/40 portfolios.
The Return Stacking landscape is ever evolving, go deeper by connecting with a team member.
Figure 6: 60/40 Equity Curves
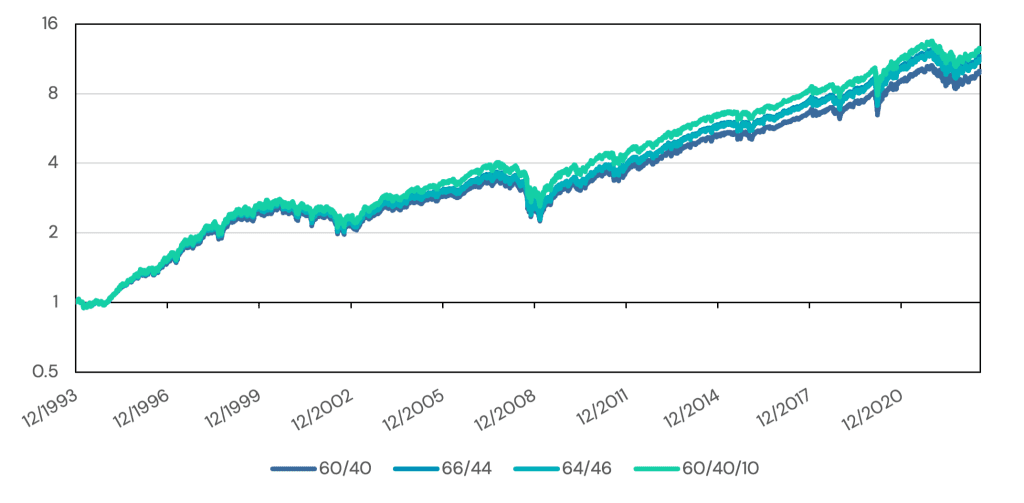
Source: Tiingo, Solactive, Kenneth French Data Library. Calculations by Newfound Research. Sharpe Ratios are calculated in excess of the Rf rate as obtained from the Kenneth French Data Library. The starting date was chosen due to data availability. Stocks is the Vanguard 500 Index Fund Investors Shares (Ticker: VFINX), Bonds is the Vanguard Total Bond Market Index Fund Investor Shares (Ticker: VBMFX). Tactical Asset Allocation Proxy is the Newfound/ReSolve Robust Equity Momentum Index, net of a 1.00% annual fee. You cannot invest directly in an index.
Finally, if we peer through into the relative performance of the stacked portfolios versus the standard 60/40, we see precisely what we expect. Figure 5 shows the relative performance of the three stacked portfolio versus the 60/40. As a reminder, in Figure 6, if the equity curve is increasing, then the stack is outperforming the strategic asset allocation, if it is decreasing, then the stack is underperforming.
Figure 7: Relative Performance of Stacked Portfolios
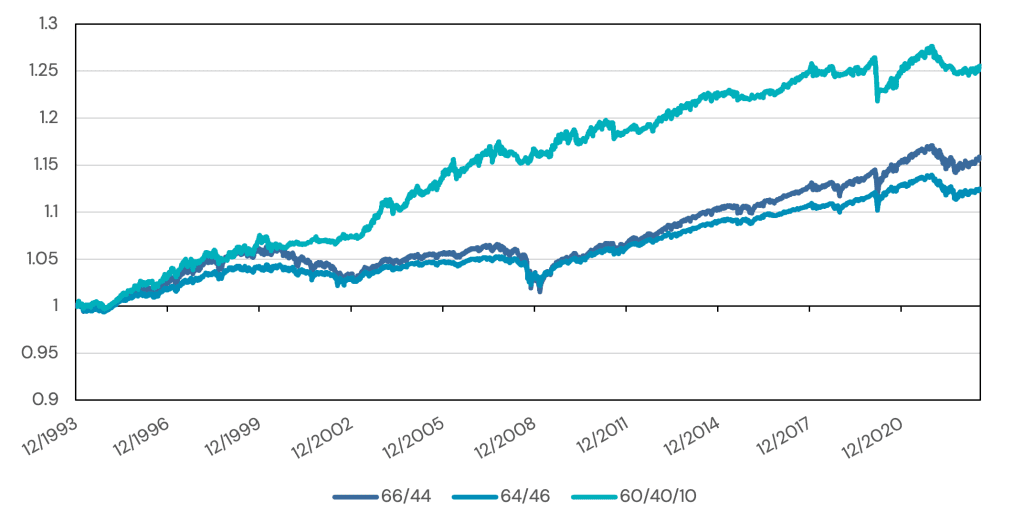
Source: Tiingo, Solactive, Kenneth French Data Library. Calculations by Newfound Research. Sharpe Ratios are calculated in excess of the Rf rate as obtained from the Kenneth French Data Library. The starting date was chosen due to data availability. Stocks is the Vanguard 500 Index Fund Investors Shares (Ticker: VFINX), Bonds is the Vanguard Total Bond Market Index Fund Investor Shares (Ticker: VBMFX). Tactical Asset Allocation Proxy is the Newfound/ReSolve Robust Equity Momentum Index, net of a 1.00% annual fee. You cannot invest directly in an index.
The proportional and inverse proportional stacked portfolios, which increased their allocation to stocks and bonds, underperformed in periods when extra exposure to stocks and bonds negatively impacted the overall portfolio. Namely, 2000-2002, 2008, 2020, and 2022. The TAA stacked portfolio, however, provided somewhat of a ballast in that the TAA strategy pivoted out of stocks in 2000-2002 and 2008. Due to the speed of the COVID crisis in 2020, TAA was largely exposed to the sharp selloff in equities. Further, in 2022 by pivoting between stocks and bonds, the 2022 selloff resulted in performance similar to that of the proportional and inverse proportional portfolios, as both stocks and bonds lost value during this period.
Conclusion
In this piece, we examined the efficacy of stacking additional stock and bond exposure on top of our existing asset allocation. While stacking additional stock or bond exposure is not inherently a poor choice for investors looking to gain additional stock or bond exposure, the empirical results suggest that there exists a better method: stacking a tactical allocation strategy.
By utilizing the available capital efficient funds to make room for an allocation to TAA, without changing the stock/bond allocation of the existing portfolio, an investor may achieve the best of both worlds, tilting towards stocks in favorable equity market environments, while potentially pivoting out of stocks to bonds in risk-on regimes.
While not a panacea, by utilizing return stacking to include a tactical strategy as opposed to a static stack, we can potentially provide risk-managed stock and bond exposure when either asset class appears more favorable than the other.
Appendix: Index Definitions
Stocks: The Vanguard 500 Index Fund (Investor Shares) (Ticker: VFINX). Performance is gross of all costs (including, but not limited to, advisor fees, taxes, and transaction costs) unless explicitly stated otherwise. Performance assumes the reinvestment of all dividends.
Bonds: The Vanguard Total Bonds Market Index Fund (Investor Shares) (Ticker: VBMFX). Performance is gross of all costs (including, but not limited to, advisor fees, taxes, and transaction costs) unless explicitly stated otherwise. Performance assumes the reinvestment of all dividends.
Tactical Asset Allocation (TAA/TAA-P): The Newfound/ReSolve Robust Equity Momentum Index, net of a 1.00% annual fee. For details on the index methodology, as well as performance results, please visit https://www.solactive.com/Indices/?index=DE000SLA8JN0. The Newfound/ReSolve Robust Equity Momentum Index as our tactical asset allocation proxy. This index implements a weekly rebalance schedule, with each week ensembling a large number of simple relative momentum and trend strategies that “vote” on the proper asset allocation based on the quantitative signals from the strategies. The weight to each asset at rebalance is proportional to the percentage of “votes” it receives from the signals. As an example of this process, if the quantitative system indicates that 20% of the trend and momentum signals indicate positive trend in U.S. equities, 20% positive trends in international equities, and 60% positive trends in intermediate-term Treasury bonds, then the index will target a 20% U.S. equity, 20% international equity, and 60% intermediate-term bond portfolio. Performance is gross of all costs (including, but not limited to, advisor fees, manager fees, taxes, and transaction costs) unless explicitly stated otherwise. Performance assumes the reinvestment of all dividends.
Risk-Free Rate: Risk-Free rate return data from the Kenneth French Data Library. Performance is gross of all costs (including, but not limited to, advisor fees, manager fees, taxes, and transaction costs) unless explicitly stated otherwise. Performance assumes the reinvestment of all dividends.
1. A handy rule of thumb is that a proposed strategy or asset will improve the Sharpe ratio (SRp) of our portfolio if SRA < correlationp,A x SRp. In this case, if the correlation-scaled Sharpe ratio of the current strategic asset allocation (SRp) is less than the Sharpe ratio of the inverse proportional stack, then it would improve our portfolio’s Sharpe.
2. The portfolios are rebalanced quarterly. All borrowing is assumed to be at the risk-free rate.
