Whenever we borrow money – whether explicitly or implicitly – we should expect to have to pay some sort of financing rate. In this article, we explore this cost of financing in futures contracts, one of the primary instruments used to implement return stacking concepts. We demonstrate that competitive market forces have, historically, kept financing rates in line with overnight borrowing rates (e.g. LIBOR/SOFR) and 3-month Treasury bill rates for Treasury and S&P 500 futures contracts.
Leverage, Financing Rate, Futures, Derivatives
The core idea behind return stacking is layering one investment return on top of another, achieving more than $1 of exposure for every $1 invested. Of course, if we want to invest more money than we have, it will require us to borrow, which means leverage. One of the key questions with any form of leverage is: how much does it cost? What is the financing rate of the money borrowed?
Many individuals will already be very familiar with this concept. Homeowners with a mortgage have borrowed money to buy an asset at a defined financing rate. Unfortunately, there are no mortgages for investors looking to buy exposure in alternative investment strategies, so we must look elsewhere for our leverage.
In some cases, it is possible for investors to borrow directly from their brokers. For example, Schwab, TD Ameritrade, and Fidelity all offer margin accounts that allow you to borrow money with rates varying from 9.25% to 14.75% depending upon how much money you plan to borrow (as of the date of publishing, 1-Month Treasury Bill reference rate is 5.51%).
Unfortunately, these interest rates impose an exceptionally high hurdle for any investment we might look to stack, since we will only be able to keep any return in excess of the borrowing rate.
Fortunately, certain markets – such as exchange-traded futures – offer much cheaper rates for borrowing.
The Theory for Competitive Rates in Futures Contracts
A foundational theorem in financial markets is the Law of One Price. This law states that – under certain assumptions – any assets with identical cash flows will have the same price.
With this in mind, consider two scenarios. In the first, we sell short a three-month S&P 500 futures contract. As a reminder, a futures contract will define an asset, a quantity, a date, and a price (among other things). The seller says, “I will deliver you this asset, on this date, in this quantity, and accept this price.” The buyer says, “I will accept delivery of this asset, on this date, in this quantity, and pay you this price.” Importantly, no cash actually changes hand when the contract is struck; it is simply an agreement between two parties. By selling the three-month S&P 500 futures contract, we’re locking in a price, in the future, at which we will deliver shares of the S&P 500.
In the second, we sell short the shares in the S&P 500 and invest the proceeds in three-month U.S. Treasury bills. In three months – at the same expiration date of the futures contract – we will buy back the shares and return them, along with any interest owed from borrowing the shares and any dividends paid along the way.
Note that both strategies require the same initial investment (nothing) and should provide the exact same proceeds. Under the Law of One Price, this means that the price of the futures contract should be determined by the current price of the features of the second trade: the current level of the S&P 500, the cost of borrowing, and dividends. If the futures price deviates from this relationship, it implies an opportunity for profit.
(More generally, the relationship between futures markets and their underlying is called Spot-Futures Parity.)
In practice, the ability for this relationship to hold will be determined by real world market frictions, such as transaction costs and the balance sheet constraints of large institutions holding these markets in order. This can increase the real-world cost of borrowing away from the theoretical “risk-free rate.” Nevertheless, in a market where institutions compete to profit from this trade, we would expect the cost of borrowing to be driven towards the risk-free rate.
For assets with physical delivery (e.g. commodities), there are additional costs. For example, if we are the seller, we have to take into account the costs of physically storing the asset, insuring the asset, and delivering the asset. These are, collectively, known as the “cost of carry.”
One of the big differences with futures, however, is that unlike when you borrow money and have to pay an explicit interest rate, the interest rate (and cost of carry) is ultimately embedded into the return of the futures contract itself. So, while you need to be aware of the financing rate, there are no additional operational steps required to manage the interest.
Tools Center:
Easily backtest & explore different return stacking concepts
Model Portfolios:
Easily backtest & explore different return stacking concepts
Future Thinking:
Receive up-to-date insights into the world of return stacking theory and practice
The Empirical Evidence for Futures Financing Rates
Theory is fine, but what cost do we actually find in practice? Here we will look at two different markets: S&P 500 Futures and 10-Year U.S. Treasury futures.
S&P 500 Futures
To examine the implied borrowing cost embedded in S&P 500 futures contracts, we construct a portfolio that goes long the S&P 500 and short an S&P 500 futures contract. The idea here is that because the S&P 500 is a fully funded position, whereas the futures contract requires zero funding, the difference in their return should isolate the implicit cost of funding in the S&P 500 futures.
Or, more simply: if we replaced our S&P 500 position with S&P 500 futures, how much would we expect to underperform over time? That underperformance should capture the embedded financing costs of futures.
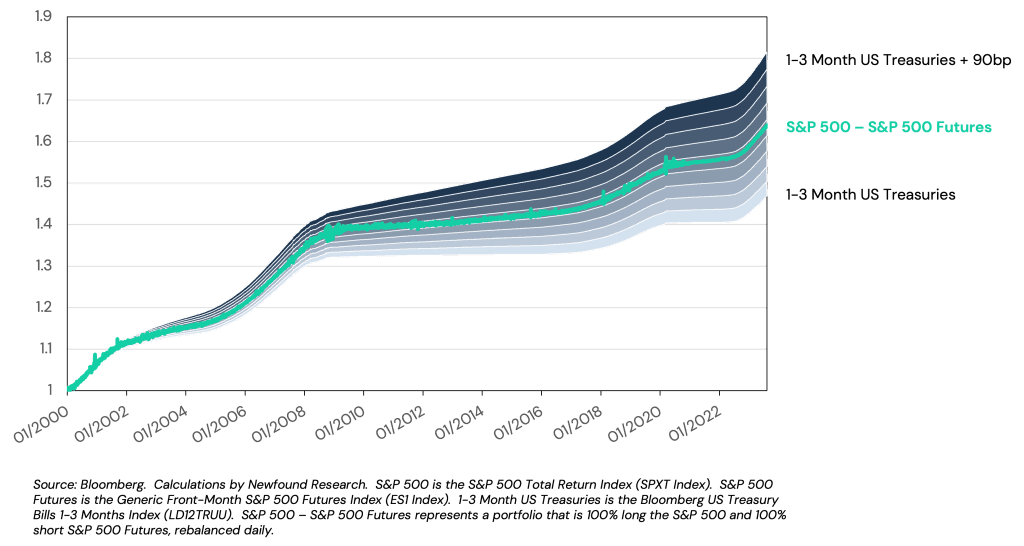
In the figure below, we plot the return of this trade as well as the return of a 1-3 Month U.S. Treasury Bill index. We also plot the returns of the same Treasury Bill index with constant annual return spreads (applied pro-rata daily) ranging from 10-to-90 basis points in increments of 10 basis points. We can see that the return of the trade has, historically, fallen squarely in the +40-50 range, suggesting that the implied funding rate has historically been similar to 1-3 Month Treasury Bill rates plus 40-50 basis points.
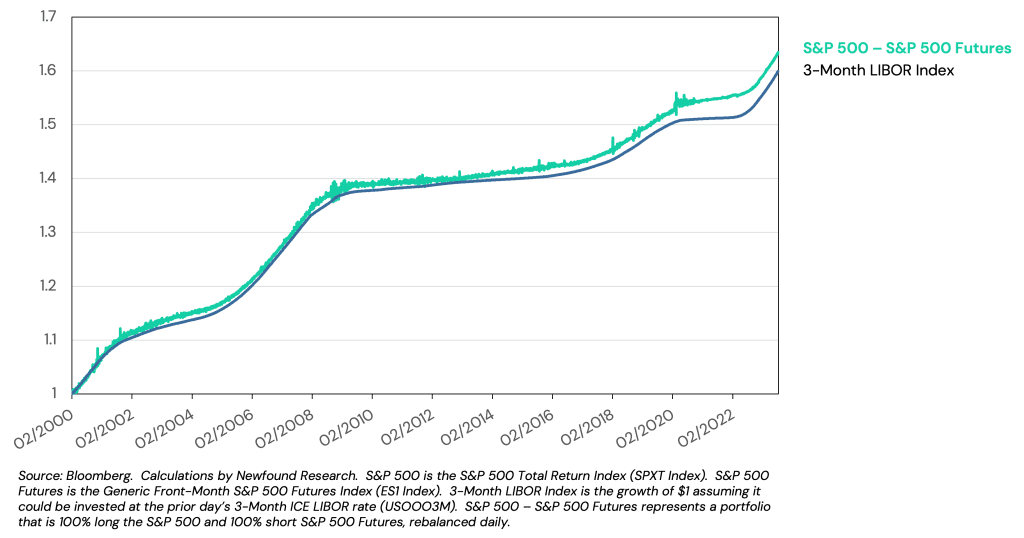
The added spread above Treasury bills reflects the added cost of borrowing for large institutions above the risk-free rate, which will account for frictions such as credit risk. In the figure below, we plot the same trade versus 3-Month LIBOR. While discontinued, we can see that, historically, the rate of financing available to those trading S&P 500 futures approached the cost of borrowing available to some of the largest institutions on Wall Street.
The Return Stacking landscape is ever evolving,
go deeper by connecting with a team member.
10-Year U.S. Treasury Futures
As our second example, we will examine 10-Year U.S. Treasury Futures. With this contract, we can track the actual bond due to be delivered at expiration and its associated repo rate – i.e. the cost of borrowing that bond in the overnight repo market.
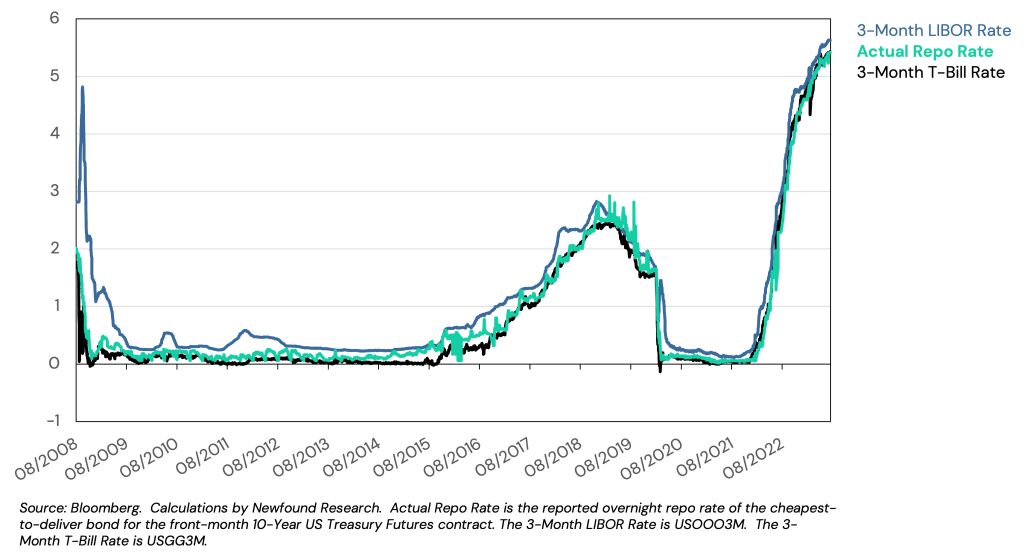
As with our original theoretical example with the S&P 500, the cost of borrowing the underlying Treasury bond is an important input to the implied financing available in Treasury futures. In the figure below, we can see that this rate has historically hovered above the 3-Month Treasury Bill rate, but below the 3-Month LIBOR rate.
(Technically, the implied repo rate would be a more accurate measure of the embedded funding cost in US Treasury futures. If the implied and actual repo rates vary meaningfully from one another, it represents a potential profit opportunity. For a variety of reasons, the implied repo rate tends to be far more volatile than the actual repo rate, and so we use the actual repo rate here.)
We can also see that this rate has traded closely to SOFR. Again, as with S&P 500 futures, Treasury futures provide an implied financing rate that is competitive with the borrowing rates available only to the largest of Wall Street institutions.
Conclusion
As we have seen, the embedded funding rates in both S&P 500 futures and U.S. Treasury futures have historically hovered near three-month U.S. Treasury bill rates and three-month LIBOR (now SOFR) rates. These are borrowing rates typically reserved for the largest financial institutions. However, through a mixture of arbitrage pricing theory (the Law of One Price and, more specifically, Spot-Futures Parity) and competitive market forces, futures markets have historically offered an embedded rate of financing that is incredibly competitive compared to other forms of borrowing money.


