With real yields reaching multi-decade highs, many investors are starting to ask whether locking in a real yield of 2.5% makes sense. In this article, we explore whether TIPS actually offer a unique exposure, why commodities may be a more capital efficient hedge to inflation, and why stacking managed futures may make the most sense of all.
TIPS, Commodities, Managed Futures
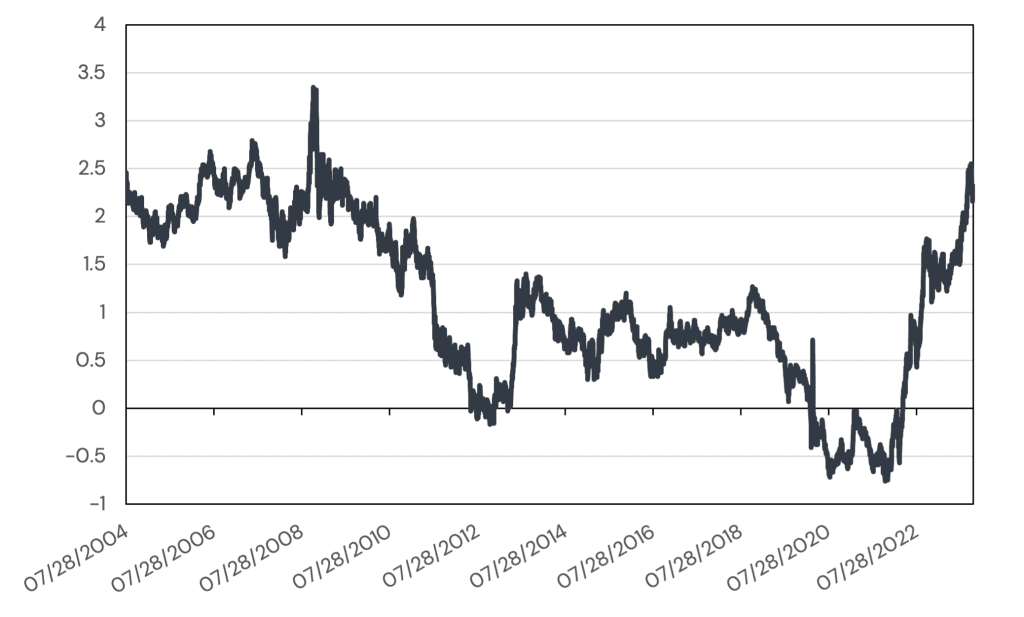
As real yields summit towards levels last seen only in the 2008 crisis, there has been no shortage of commentary in recent months about the potential attractiveness of long-dated TIPS. After all, locking in a 2.5% real rate of return for the next twenty years may be particularly compelling for investors looking to immunize far-dated real dollar liabilities (i.e. almost everyone investing for retirement).
Source: Bloomberg. Federal Reserve US Treasury H15 Constant Maturity 20-Year Real Yield Curve Rates (“H15X20YR”).
TIPS versus Commodities
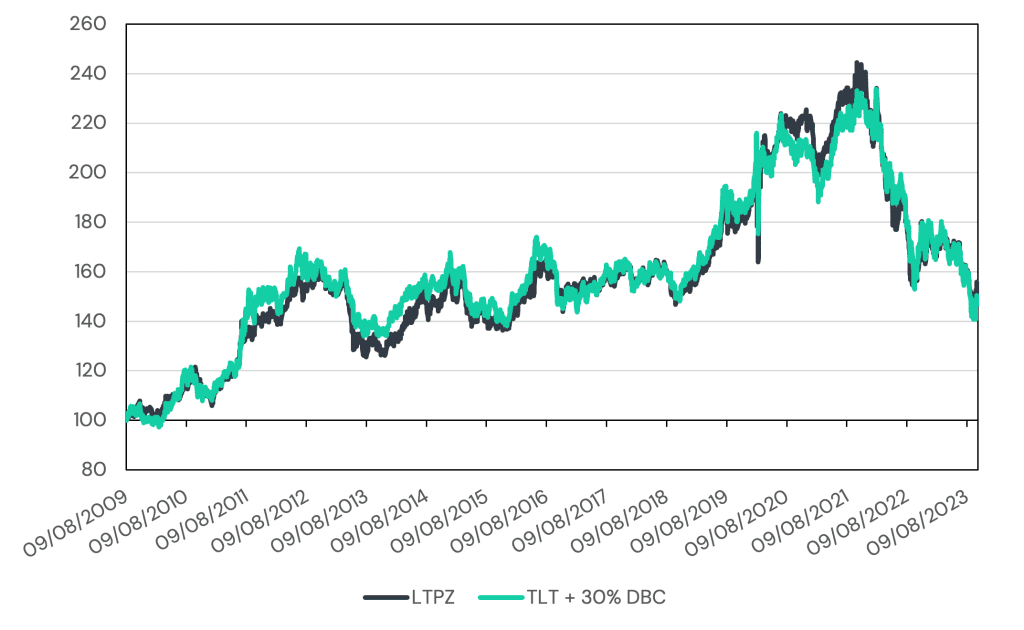
But how unique an opportunity do TIPS actually present? First auctioned in 1997, the actual performance of TIPS in inflationary regimes like the 1970s can, at best, be speculated at via modeling. If we evaluate the performance of funds that track TIPS, however, we find a rather curious result: the performance can be almost perfectly replicated by a simple combination of U.S. Treasuries and commodities. In Figure 1, we show how long-dated TIPS behave just like a portfolio of long-dated Treasuries overlaid with a 30% position in a diversified commodity basket.
Source: Bloomberg. LTPZ is the PIMCO 15+ Year US TIPS Index ETF. TLT is the iShares 20+ Year Treasury Bond ETF. DBC is the Invesco DB Commodity Index ETF. TLT + 30% DBC is a portfolio that is 100% TLT / 30% DBC / -30% BIL rebalanced daily. BIL is the SPRD Bloomberg 1-3 Month T-Bill ETF. Returns assume the reinvestment of all distributions. Returns are gross of all fees, transaction costs, and taxes except for underlying ETF expense ratios. Performance is backtested and hypothetical.
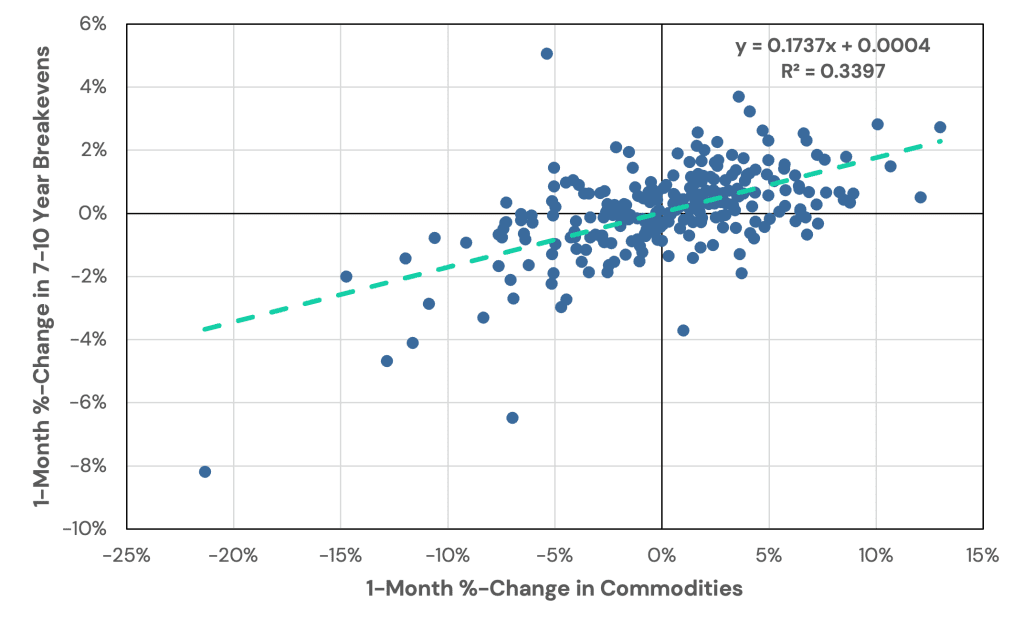
The relationship also appears to hold for shorter-term TIPS as well, though in a slightly diluted form. In Figure 2 we plot the 1-month return of 7-10 year breakevens (i.e. long TIPS / short Treasuries) versus the 1-month excess returns of commodities. While noisy, the regression line tells us that a 17% position in commodities approximates the return of breakevens.
Source: Bloomberg. 7-10 Year Breakevens is a portfolio that is long 100% 7-10 Year TIPS and short 100% 7-10 Year UST, rebalanced monthly. 7-10 Year TIPS is the S&P 7-10 Year U.S. Treasury TIPS Total Return Index (SPBDU0T). 7-10 Year UST is the Bloomberg U.S. Treasury 7-10 Year Total Return Index Value Unhedged (LT09TRUU). Commodities is the Bloomerg Commodity Index (Excess Returns). Returns assume the reinvestment of all distributions. Returns are gross of all fees, transaction costs, and taxes. Performance is backtested and hypothetical.
Tools Center:
Easily backtest & explore different return stacking concepts
Model Portfolios:
Easily backtest & explore different return stacking concepts
Future Thinking:
Receive up-to-date insights into the world of return stacking theory and practice
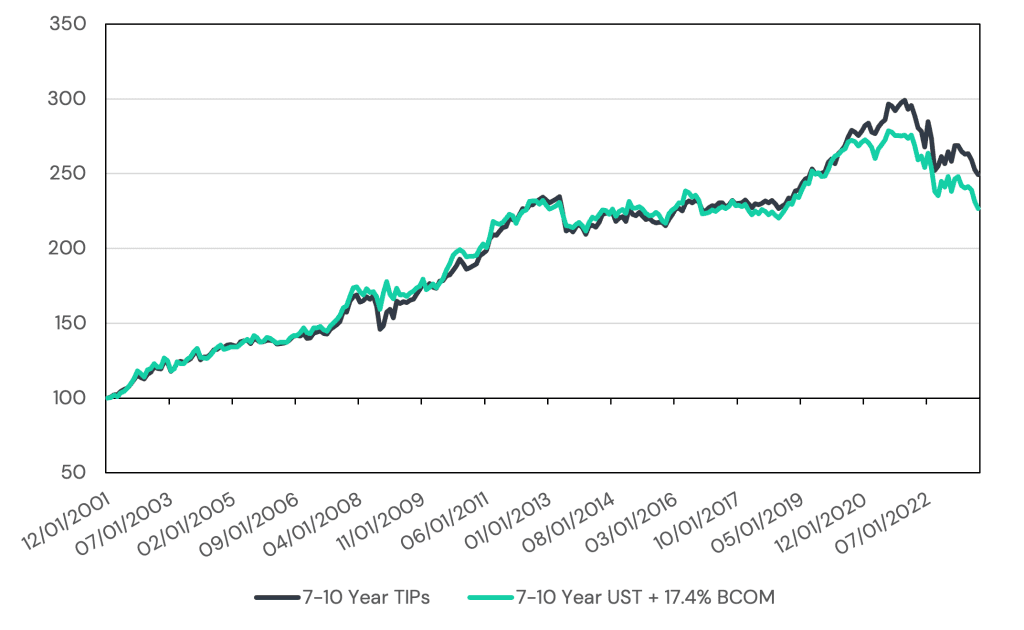
In Figure 4, we plot the fit of a 17% overlay of commodities on top of nominal intermediate-term Treasuries versus intermediate-term TIPS.
Source: Bloomberg. 7-10 Year TIPS is the S&P 7-10 Year U.S. Treasury TIPS Total Return Index (SPBDU0T). 7-10 Year UST is the Bloomberg U.S. Treasury 7-10 Year Total Return Index Value Unhedged (LT09TRUU). BCOM is the Bloomerg Commodity Index (Excess Returns). 7-10 Year UST + 17.4% BCOM is a portfolio that is 100% 7-10 Year UST / 17.4% BCOM rebalanced monthly. Returns assume the reinvestment of all distributions. Returns are gross of all fees, transaction costs, and taxes. Performance is backtested and hypothetical.
At first, this may seem somewhat intuitive: commodities are a substantial component of the CPI basket, both explicitly (i.e. the measured cost of energy and food prices) and implicitly (i.e. as an input to business costs that flow through the consumer). However, it is by no means the only component of CPI.
Furthermore, if TIPS are priced based upon forward inflation expectations why would the contemporaneous price changes of front-month commodities futures be a good fit? And why do commodities appear to be a good fit for both long- and intermediate-term changes in inflation expectations with only a small adjustment to overall exposure?
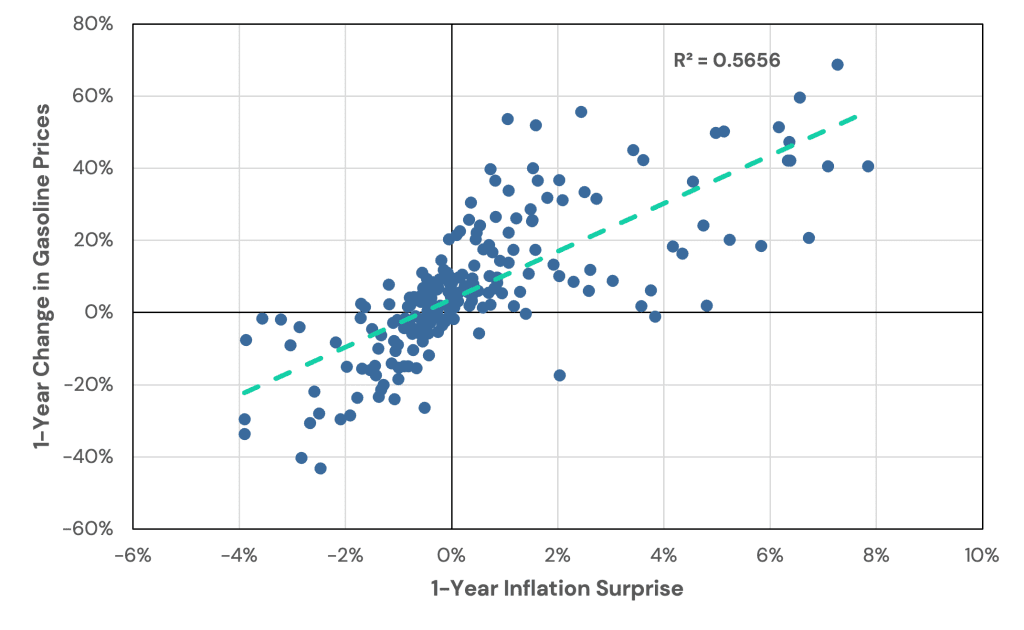
If markets are efficient, TIPS should only outperform nominal Treasuries via the accumulation of upside inflation surprises. As it turns out, commodities represent a disproportionate amount of CPI surprise. Gasoline, for example, accounts for approximately 50% of U.S. CPI surprise variance despite only representing around 3% of U.S. CPI.
(For comparison, in a similar univariate regression, year-over-year changes in Food Prices, Commodities less Food & Energy, Services less Energy Services, and Energy Services account for 2%, 32%, 27%, and 34% respectively.)
Source: Federal Reserve of St. Louis; Federal Reserve of Philadelphia. Calculations by Newfound Research. 1-Year Inflation Surprise is 1-Year CPI Forecast for the Survey of Professional Forecasters minus the realized year-over-year change in the Consumer Price Index for All Urban Consumers: All Items in U.S. City Average index (“CPIAUCSL”). 1-Year Change in Gasoline Prices is the year-over-year change in the Consumer Price Index for All Urban Consumers: Gasoline (All Types) in U.S. City Average index (“CUSR0000SETB01”). Period covered is 6/30/1970 to 9/30/2023.
One of the interesting implications of this analysis is that commodities may actually be a much more capital efficient means of fighting inflation. While TIPS are guaranteed to preserve the real return of capital (at least with respect to the CPI basket), they will only do so directly for the dollars allocated.
The analysis above suggests that a small dose of commodities can actually hedge a larger part of the portfolio from inflation shocks. After all, it only takes a 17% overlay of commodities on intermediate-term U.S. Treasuries to approximate intermediate-term TIPS.
There is also a subtler point to be made here: if TIPS hedge our inflation risk, we would expect them to provide the return of nominal Treasuries minus some premium paid for the embedded inflation hedge. However, if we can perfectly replicate TIPS with a combination of nominal Treasuries and commodities, it follows that commodities should offer a negative risk premium over the long run.
Bhardwaj, Janardanan, and Rouwenhorst (2021), however, find that commodity futures contracts have historically earned a positive risk premium, suggesting either that there is significant basis risk in using commodities as a hedge to CPI shocks or that commodities also introduce unique risk factors not present in TIPS that demand further compensation.
The Return Stacking landscape is ever evolving,
go deeper by connecting with a team member.
Navigating Deflation with Managed Futures
The potential problem with holding commodities as a strategic hedge against inflation is that the exposure to CPI surprises is largely linear. In other words, while they will, on average, respond positively to positive surprises, they will also, on average, respond negatively to negative surprises.
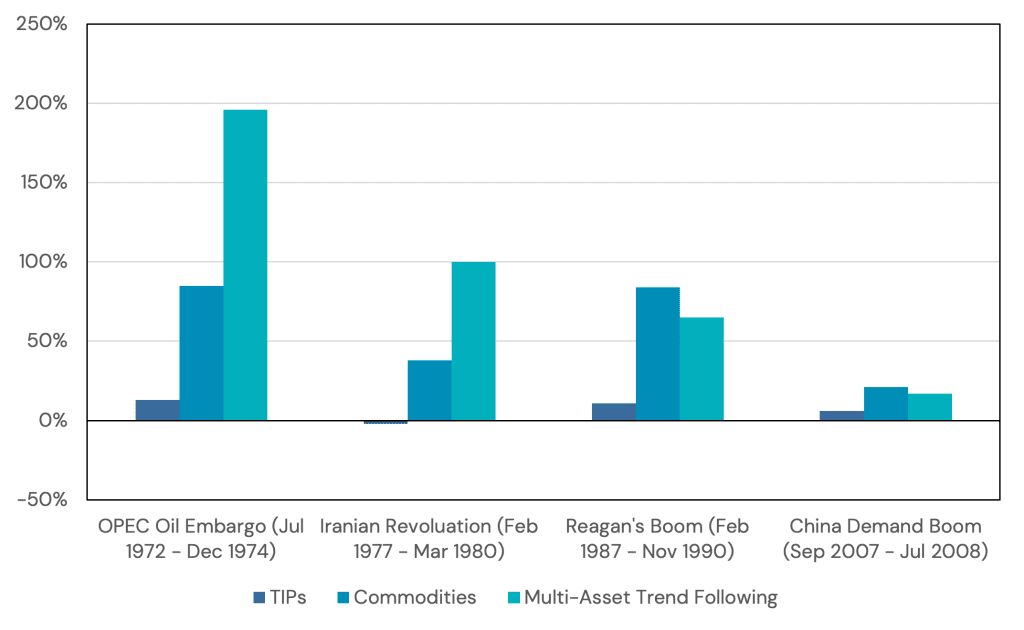
Neville, Draaisma, Funnell, Harvey, and Van Hemert (2021) (“NDFHH (2021)”) find that while broad commodities have offered significant positive returns during all major U.S. inflationary regimes since 1946, the real returns during deflationary regimes (representing 81% of the data set) annualized to just 1%. These are fully funded commodity future returns, however, suggesting that the excess-of-cash return of commodities during deflationary periods is significantly negative.
Turning to dynamic strategies, NDFHH (2021) find that multi-asset trend following (i.e. “managed futures”) not only exhibits positive real returns during inflationary periods but also positive real returns during deflationary periods. Furthermore, when broken out into distinct asset classes – bonds, commodities, currencies, and equities – trend following exhibited positive annualized returns across both regime types for all sub-strategies.
Source: NDFHH (2021).
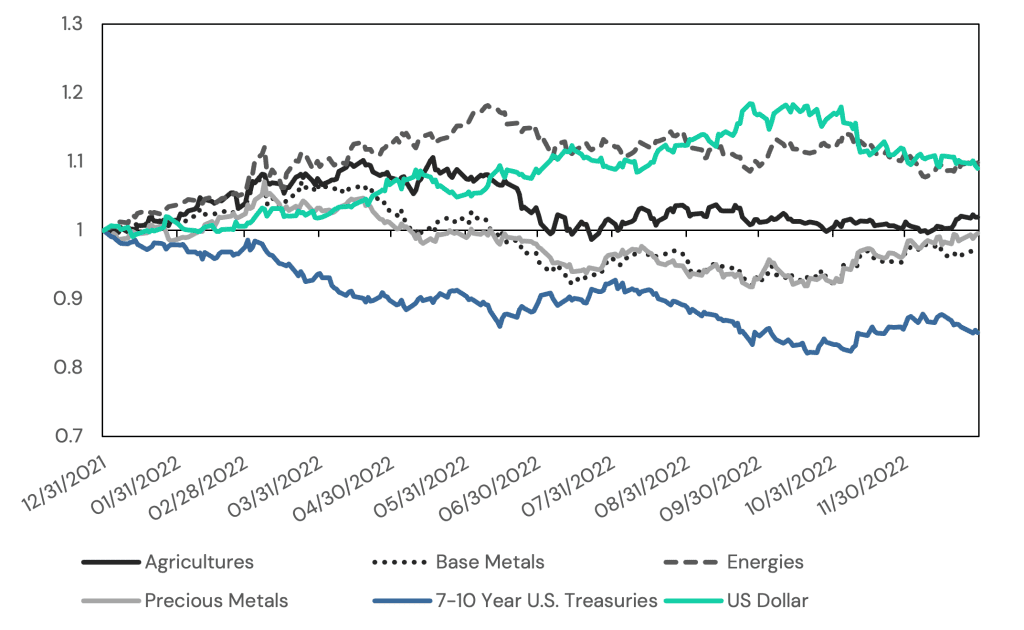
While commodities have, historically and on average, performed well during inflationary regimes, it is worth acknowledging that inflation can arise from several places, including economic supply shocks, economic demand shocks, fiscal policy, and monetary policy. The reaction function of commodities to these different sources of inflation will differ depending upon the source.
For example, in 2022, agricultural commodities, base metals, and precious metals largely ended the year flat, while energies exhibited positive returns only through the first five months of the year (coinciding with the peak in year-over-year CPI surprise). As it turns out, U.S. Treasuries and the U.S. dollar, largely driven by central bank policy decisions in reaction to inflation, exhibited the strongest trends.
Source: Tiingo. Agricultures is Invesco DB Agricultures Fund (“DBA”). Base Metals is Invesco DB Base Metals Fund (“DBB”). Energies is Invesco DB Energy Fund (“DBE”). Precious Metals is Invesco DB Precious Metals Fund (“DBP”). 7-10 Year US Treasuries is iShares 7-10 Year Treasury Bond ETF (“IEF”). US Dollar is WisdomTree Bloomberg US Dollar Bullish Fund (“USDU”). Returns assume the reinvestment of all distributions. Returns are gross of all fees, transaction costs, and taxes except for underlying ETF expense ratios. Return streams are scaled to a constant 10% realized volatility.
Bonds + Managed Futures > TIPS?
With an eye towards generating long-term positive real returns, many investors today have their eyes on TIPS. However, historical analysis suggests that TIPS may be naively replicated through a combination of U.S. Treasuries and a basket of diversified commodities.
While TIPS will provide inflation protection for each dollars allocated, commodities offer a higher beta to inflation, making them a more capital efficient solution. For example, a 1% position in a diversified commodity basket may be able to provide inflation protection for 5-6% in intermediate-term U.S. Treasuries.
The trade-off being that while TIPS offer a guaranteed hedge against inflation and allow us to lock in a real rate of return (so long as we define inflation the same way as the CPI basket), commodity exposure does not.
That said, one could easily flip the argument and say that TIPS are the capital efficient strategy. After all, they are akin to a return stacked U.S. Treasury and commodity portfolio! For example, if we own 60% stocks and 40% intermediate-term U.S. Treasuries and replace all our U.S. Treasury exposure with TIPS, it would be approximately equivalent to owning a 60% stocks / 40% U.S. Treasuries / 7% commodity portfolio.
Evaluating TIPS though this lens, however, raises an important question: “do we even want to stack commodities?” Evidence suggests that commodities have a linear relationship with inflationary shocks, making them a drag on portfolio returns during deflationary cycles. NDFHH (2021) demonstrates that managed futures, on the other hand, have historically provided ample inflation protection while still generating positive returns during deflationary periods. Overlaying managed futures may, then, be a more compelling long-term allocation.
Of course, in the spirit of diversification, there may be an argument for holding both. TIPS can offer compelling mechanism to hedge future liabilities with a known real rate of return while stacking managed futures may provide a meaningful hedge against future inflation shocks without necessarily suffering during periods of deflation.
