Trend Following Through Turmoil: Why the Best Protection Comes After the First Punch
Overview
Key Topics
“Isn’t this supposed to hedge my equity risk? Why isn’t it working now?”
It’s a fair question. And the answer, like with most things in investing, is nuanced. It requires digging into the historical evidence and understanding how and when trend following tends to provide its diversification benefits during equity crises.
Spoiler alert: trend following is rarely the hero in the first act of a bear market drama.
Its potential value often emerges later, during the long, grinding second act.
Act I: The Initial Shock (Peak -> -10%)
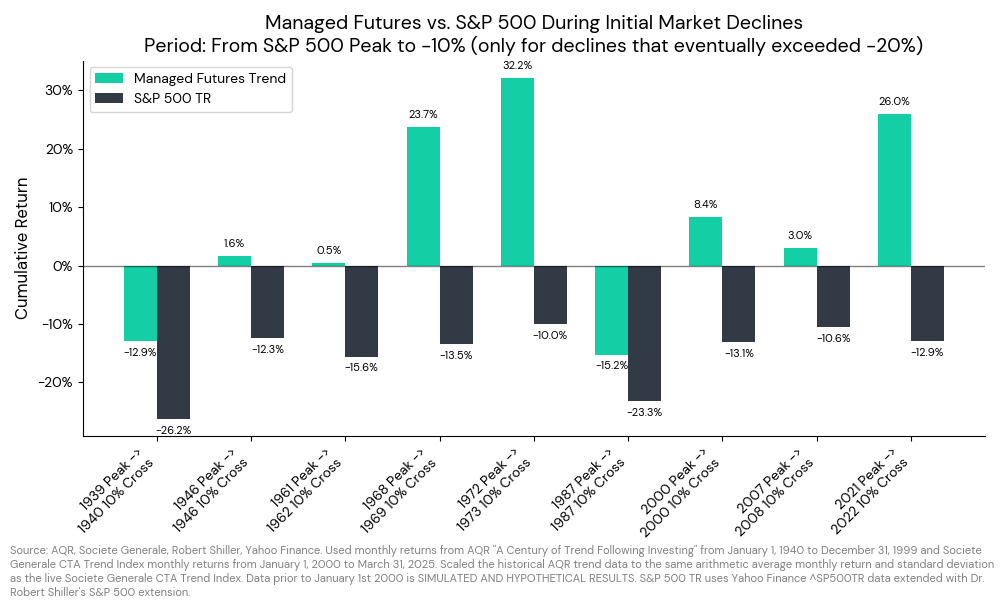
Let’s start by managing expectations. What happens when a bull market rolls over and experiences its first significant stumble – that initial 10% decline? We looked at historical S&P 500 drawdowns since 1940 that eventually exceeded -20% and isolated the performance of both the S&P 500 and a diversified Managed Futures Trend strategy from the market peak until it first crossed the -10% threshold (astute readers will note that the S&P 500 bars are never exactly at 10%, this is due to the fact we are using monthly data).
CHART 1: Managed Futures vs. S&P 500 During Initial Market Declines (1940 - Present)
Why? Trend following, by its very nature, is reactive. It identifies and participates in established trends. Sharp, sudden reversals – the kind that often characterize the start of a significant market decline – can catch trend followers flat-footed or even positioned the wrong way (e.g., still long equities from the prior bull run). It takes time for new downtrends to become significant enough for systematic models to recognize and reposition portfolios accordingly (e.g., go short equities, long bonds, adjust currency exposures, etc.).
So, if you’re looking at your trend following strategy during the first 5-10% pullback and wondering why it isn’t immediately zigging while the market zags, this historical context is key. It’s often not designed to be a perfect shock absorber for the initial impact.
Register for our Advisor Center
Tools Center:
Easily backtest & explore different return stacking concepts
Model Portfolios:
Return stacked allocations, commentary and guidance designed
for a range of client risk profiles and goals
Future Thinking:
Receive up-to-date insights into the world of return stacking theory and practice
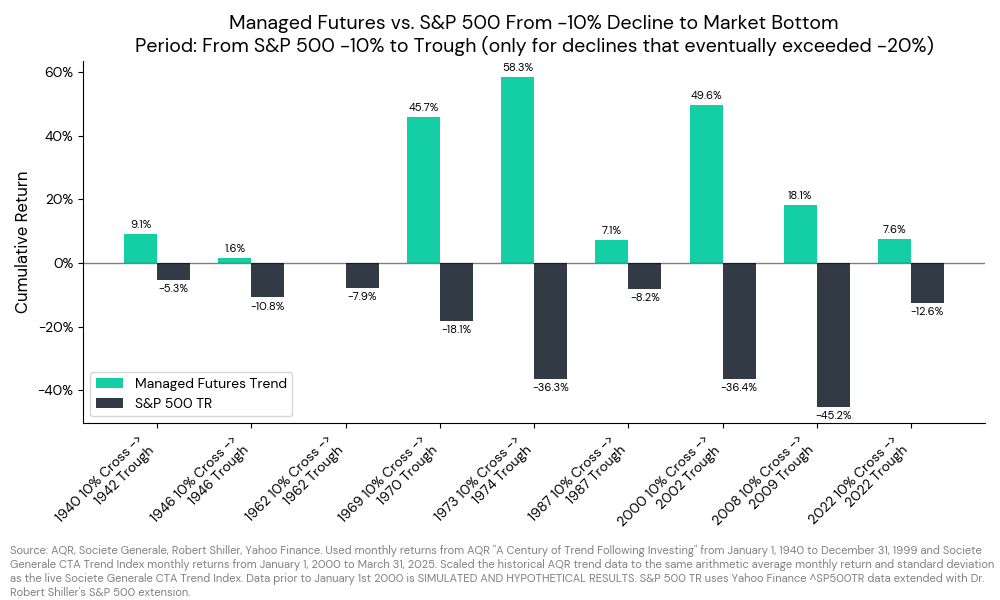
This is where the narrative for trend following often shifts. We examined the same historical periods since 1940, but this time measured performance from the moment the S&P 500 first crossed -10% until it reached its trough.
CHART 2: Managed Futures vs. S&P 500 From -10% Decline to Market Bottom (1940 - Present)
While the S&P 500 continued its descent, often severely (look at 1973-74, 2000-02, 2007-09!), managed futures trend frequently generated substantial positive returns during this same period. Think about the stark contrast in 1973-74: S&P 500 TR down another -36.3%, while Managed Futures Trend gained +58.3%. Or 2000-02: S&P 500 TR -36.4%, Managed Futures Trend +49.6%. Even the period from the 1970 cross to trough saw trend gain +45.7% while the S&P continued to fall. Even in periods where trend wasn’t massively positive, it often provided significant relative performance compared to the cratering equity market (e.g., 1987 Trough, 2009 Trough).
There are exceptions, of course (1946, 1962, and 2022 stand out as periods where trend posted losses during this second phase), because no diversification strategy works perfectly every single time. But the historical pattern is compelling.
Why the improvement? By this stage:
- Trends are Established: The initial shock has subsided, and persistent downward (or sideways) movement in equities, and potentially corresponding trends in other asset classes (like bonds, currencies, or commodities), have had time to emerge and become statistically identifiable.
- Repositioning Occurs: Trend following models have had the necessary time and data to confirm the new regime and adjust positions accordingly – potentially going short equities, increasing bond allocations if they are trending higher, or capturing trends in other markets that may benefit from the same macro environment causing equity stress.
- Diversification Benefits Manifest: The strategy starts capturing returns from trends across a diverse range of global markets, providing returns that are largely uncorrelated, or even negatively correlated, to equities during this specific crisis phase. This is the “crisis alpha” potential that trend following is often lauded for.
So, what does this mean for investors grappling with the current market volatility, triggered by the latest round of tariff threats?
- Don’t Panic (Based on Act I): Trend following strategies often lag during sharp initial drops, which is consistent with how they’re designed.
- Patience is Key (Anticipating Act II): Trend following tends to show its value during prolonged downturns, no right after the first decline.
- Consider the Opportunity (For Non-Holders): For those without exposure, time to get excited! Adding trend following now could align with periods when it has historically provided the most diversification.
For those without exposure, time to get excited! adding trend following now could align with periods when it has historically provided the most diversification.
This historical “two-act” performance profile of trend following is precisely why it can be such a powerful component within a Return Stacking™ framework.
The core idea of Return Stacking is to layer diversifying return streams onto a core portfolio, often using capital-efficient methods, to enhance overall risk-adjusted returns without drastically altering the primary allocation (like your stock/bond mix).
Trend following fits this mandate beautifully, but with the crucial caveat illuminated by our “Act I / Act II” analysis:
- The “Act II” Diversification is Key: The real magic for a Return Stacker isn’t necessarily hoping trend will save you from the first 10% drop. It’s the potential for trend to generate positive or significantly less negative returns during the prolonged, painful “Act II” grind when traditional assets might be deep in the red. This is the non-correlated “crisis alpha” that genuinely diversifies your primary equity beta when it matters most.
- Capital Efficiency Enables the Stack: Trend following strategies, particularly those accessed via futures (which often underlie trend ETFs), are highly capital-efficient. This allows investors to “stack” this potential “Act II” diversification onto their existing portfolio without needing to sell large chunks of their core holdings. You’re adding a potential shock absorber for the later, often deeper, stages of a bear market.
- Understanding Behavior is Crucial for Stacking: Knowing how trend typically behaves – reactive, not predictive, often shining after the initial turmoil – helps Return Stackers set realistic expectations and maintain discipline. You’re not stacking an immediate hedge; you’re stacking a strategy with a history of providing valuable diversification during sustained market stress.
So, when viewed through the Return Stacking lens, the initial drawdown performance of trend following isn’t a bug; it’s a feature stemming from its reactive nature. The patience required to potentially benefit from its “Act II” performance aligns perfectly with the long-term, systematic approach inherent in Return Stacking. It’s about building a more resilient portfolio by layering strategies that behave differently, especially during different phases of market turmoil.
Understanding how and when a strategy tends to deliver its benefits is crucial for sticking with it. Trend following managed futures are not a magic bullet against all market declines, especially the sharp, initial shocks. However, history suggests that during the longer, grinding phases of significant bear markets – the periods after the first 10% drop – trend following has often provided valuable, diversifying returns precisely when equity investors needed them most.
As we navigate the current uncertainty, remember the two-act structure of historical drawdowns. While Act I might be uncomfortable, Act II is often where strategies like trend following have historically taken center stage – providing the type of diversifying return stream that Return Stackers actively seek.
Disclaimers:
This article is for informational purposes only and should not be considered investment advice. Past performance is not indicative of future results. Hypothetical and simulated performance have inherent limitations. All investments involve risk, including the potential loss of principal.


